Networthy — by Ten Dimension Labs

Every broker, every account, one honest number.

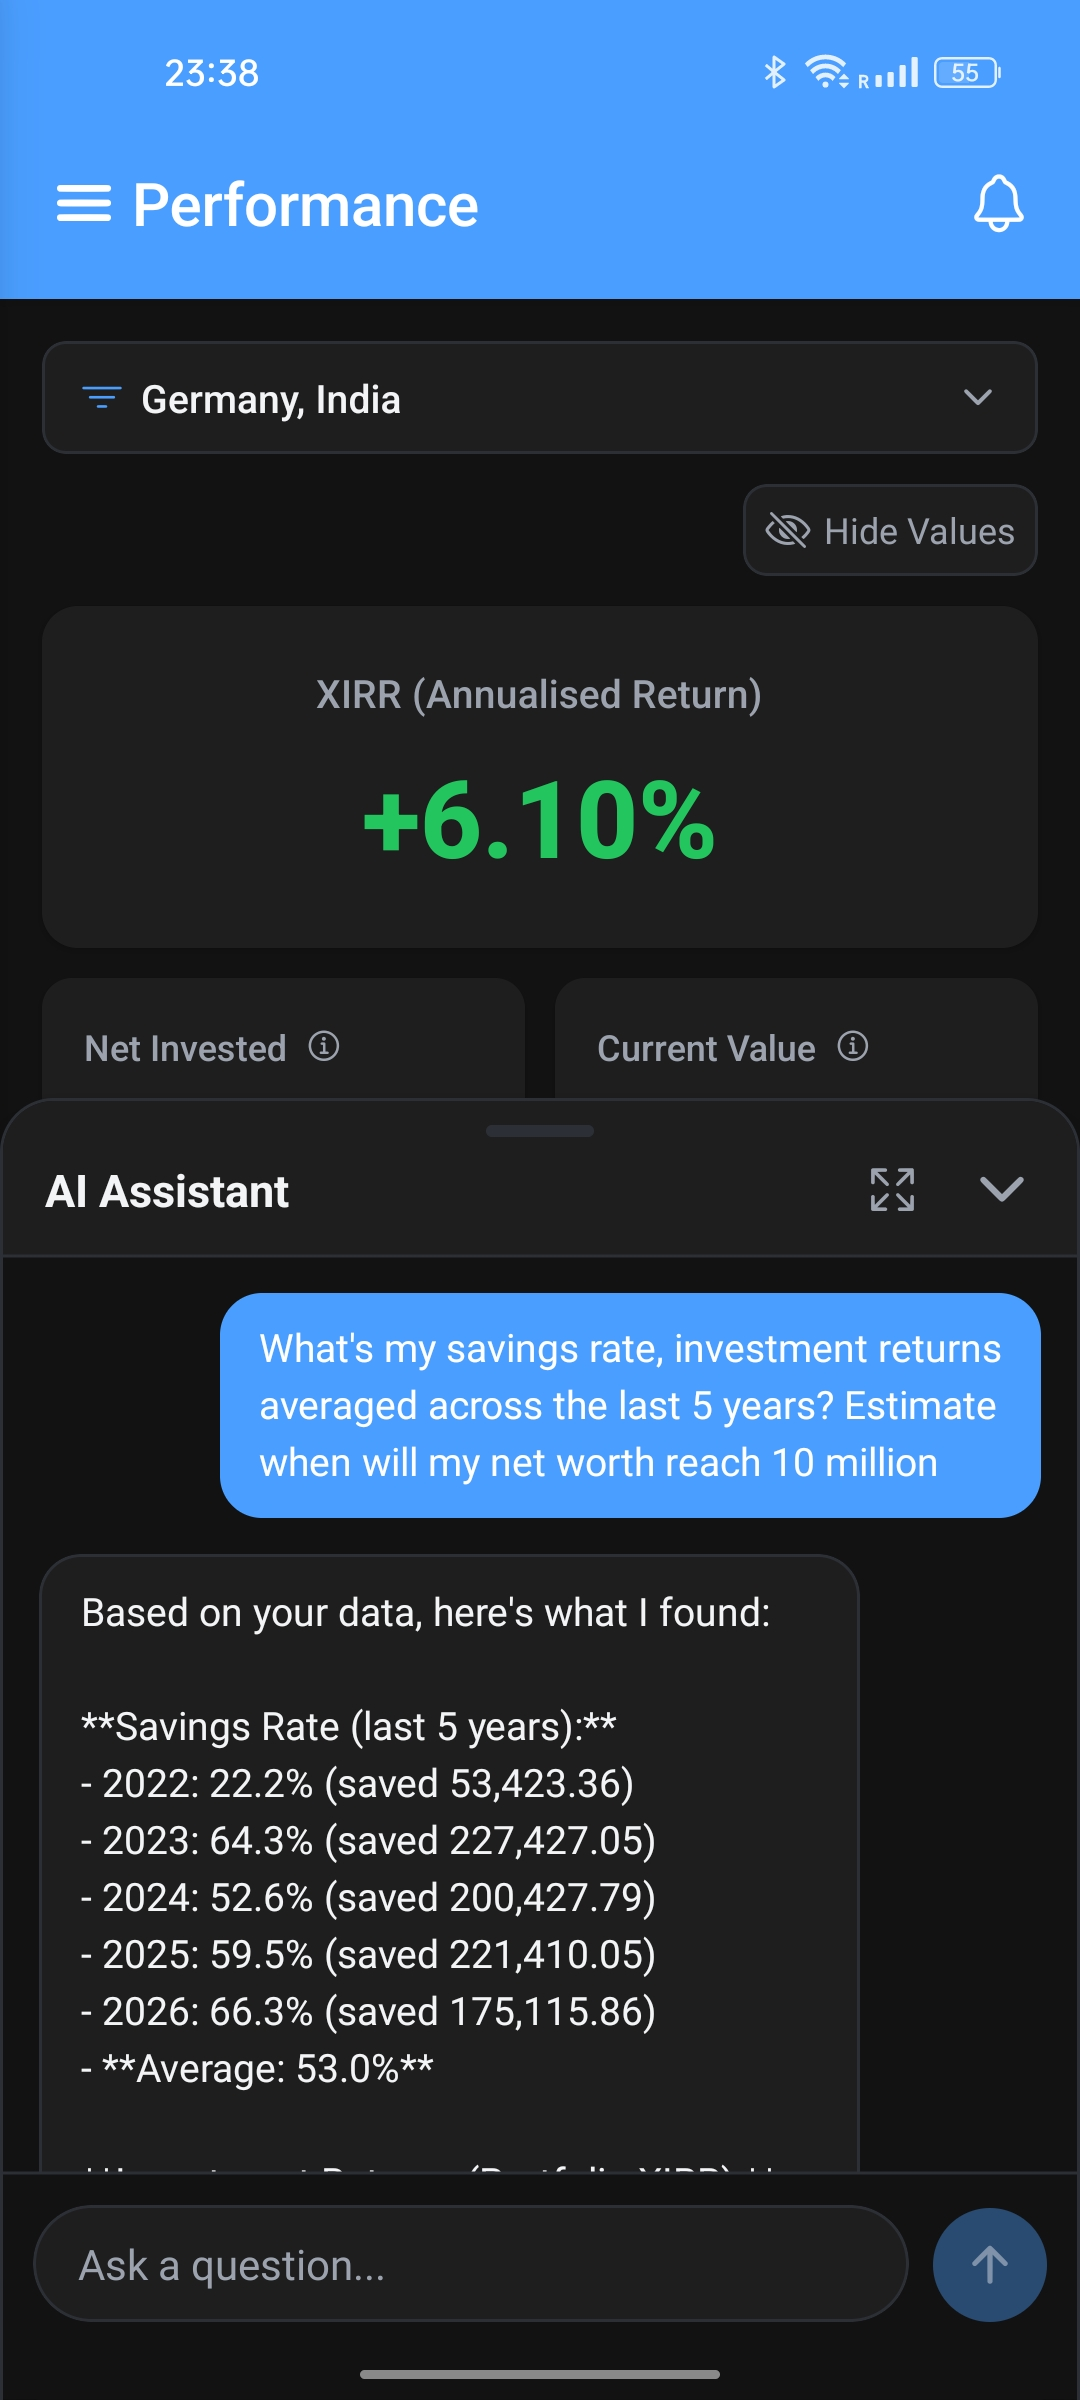
Networthy consolidates your bank accounts and every brokerage into a single portfolio — real average-cost math across brokers, true time-weighted vs. money-weighted returns, and dividend income net of withholding tax. Everything stays on your device.
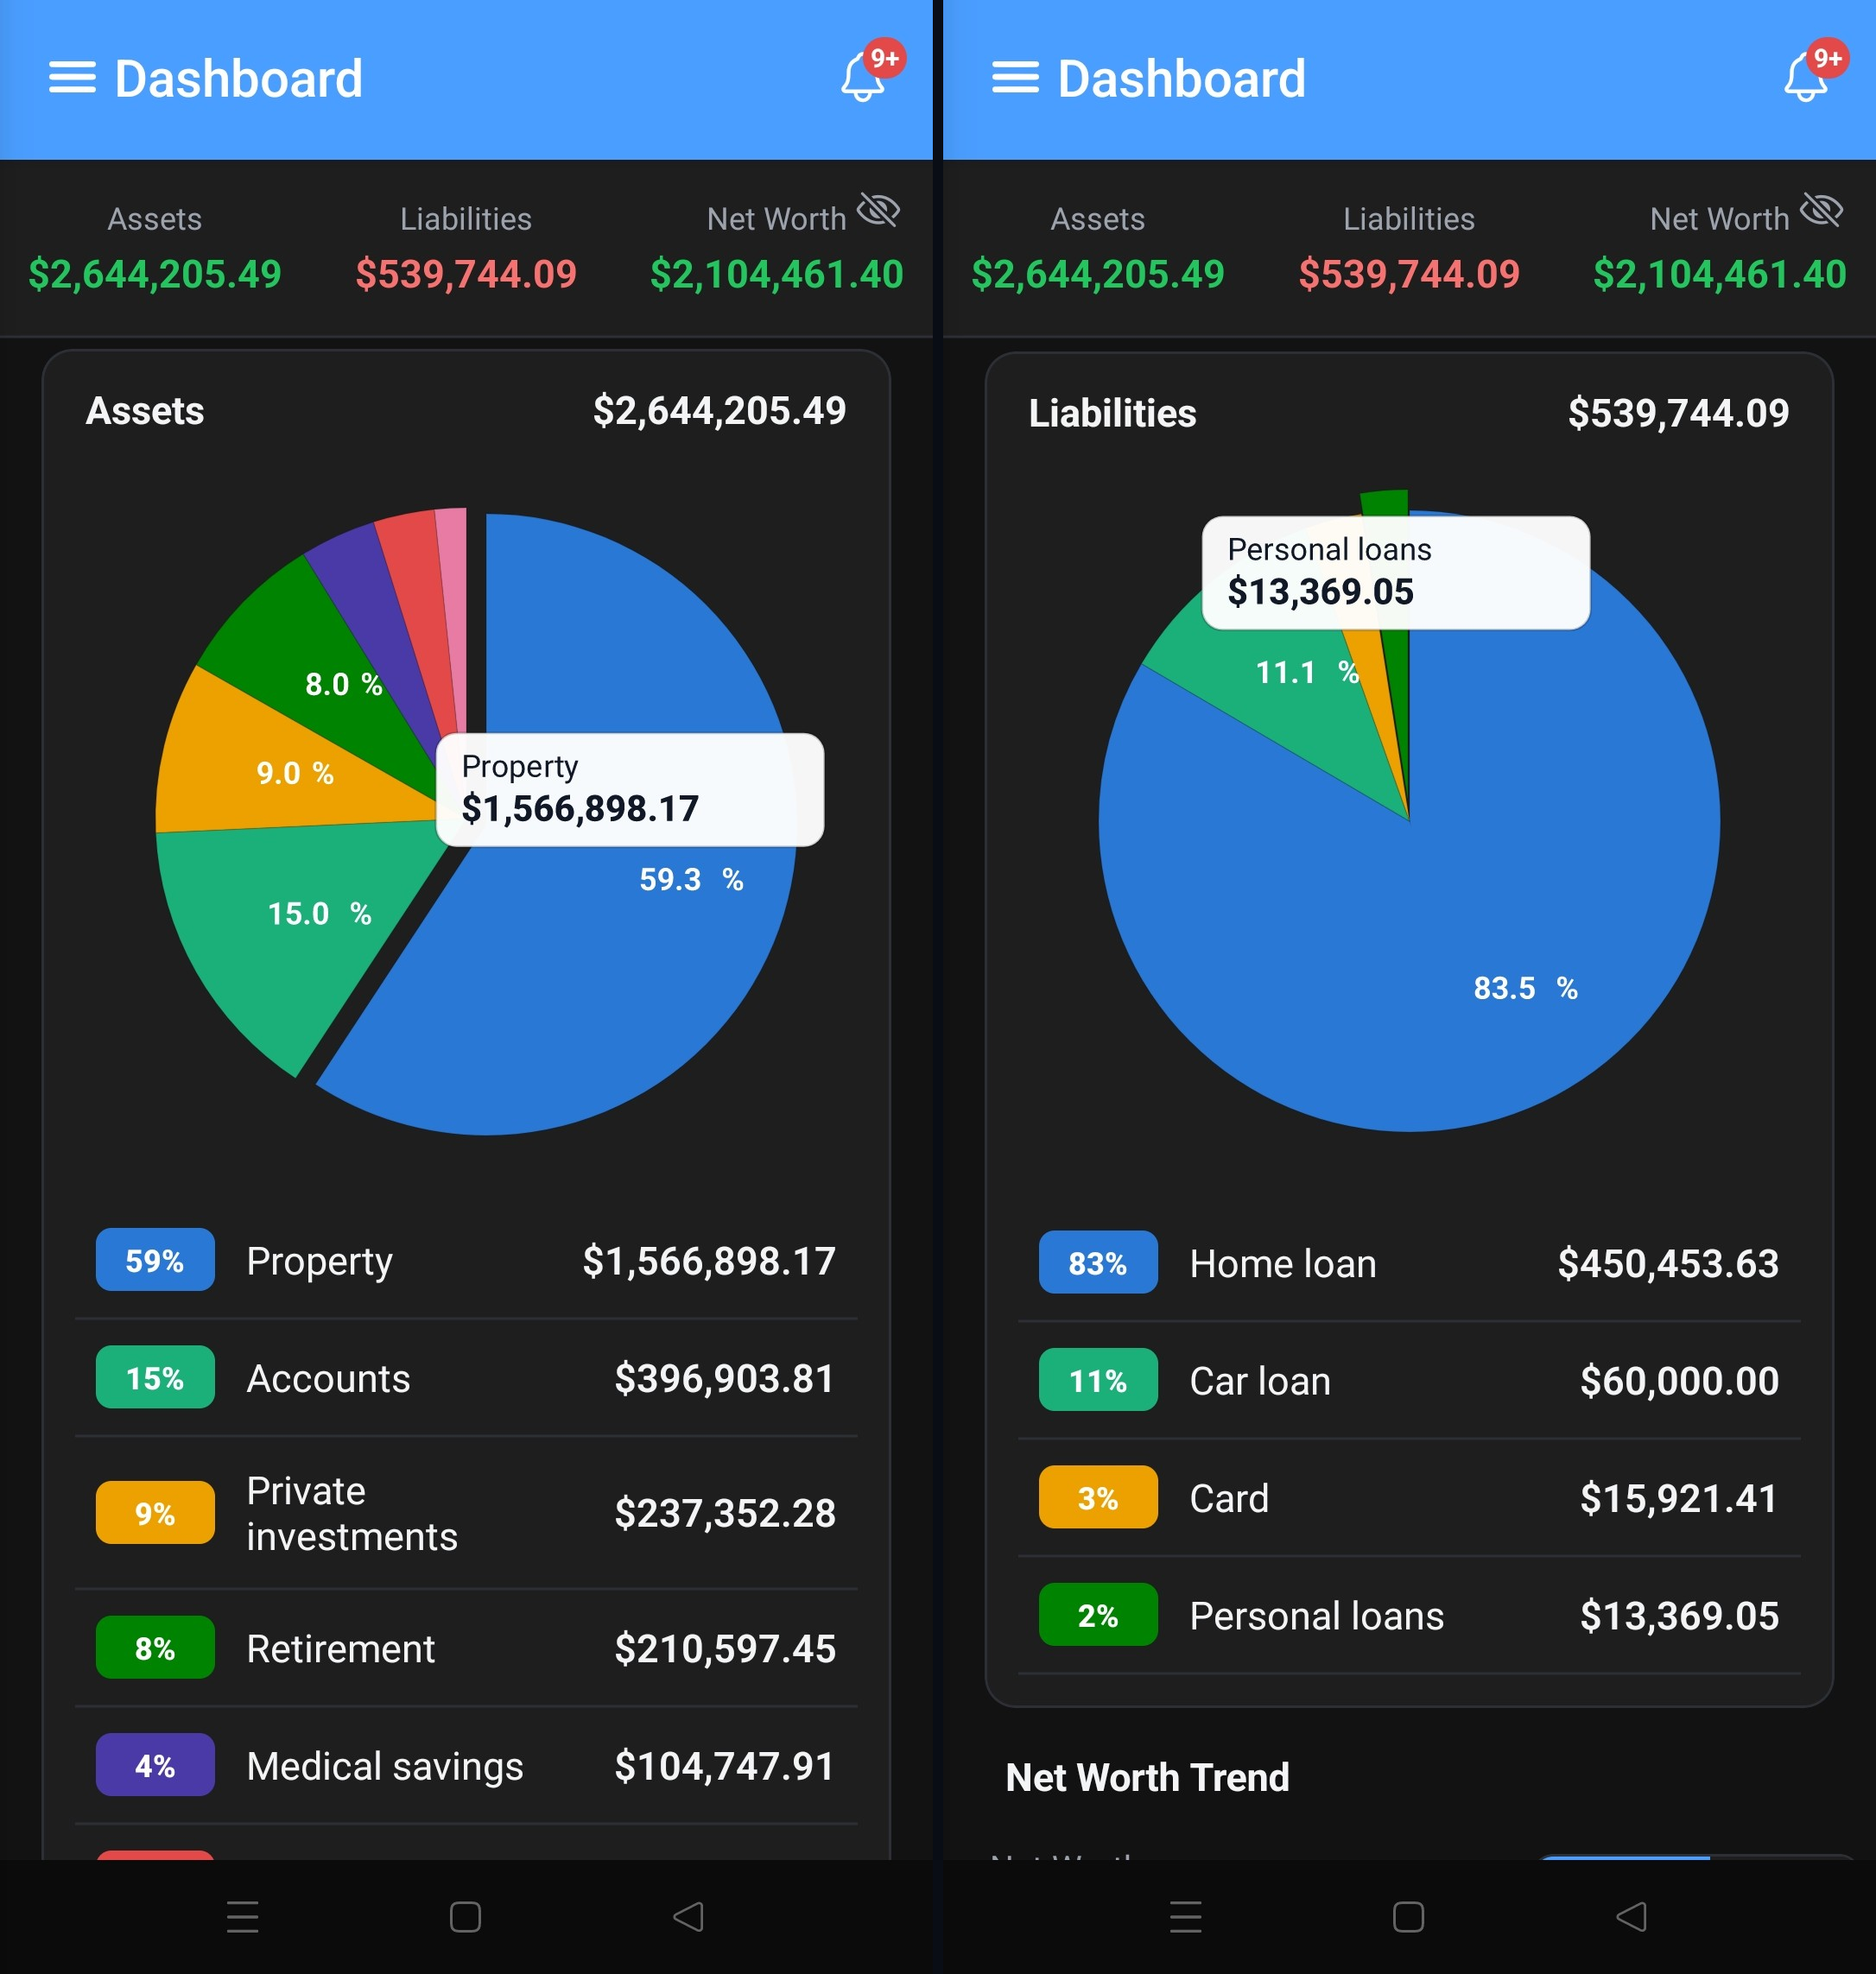
Screenshot Net Worth Dashboard — donut chart combining bank and investment accounts into one net-worth number
Why Networthy

Things most finance apps don't do

Not a longer feature list — a few specific things that actually require different math, not just a prettier chart.

True multi-broker average cost, not side-by-side accounts

Buy the same stock across three brokers and Networthy merges every lot into one real average-cost position — while still letting you drill into any single broker's own lots. Most trackers just list your accounts next to each other; this actually does the cost-basis math.

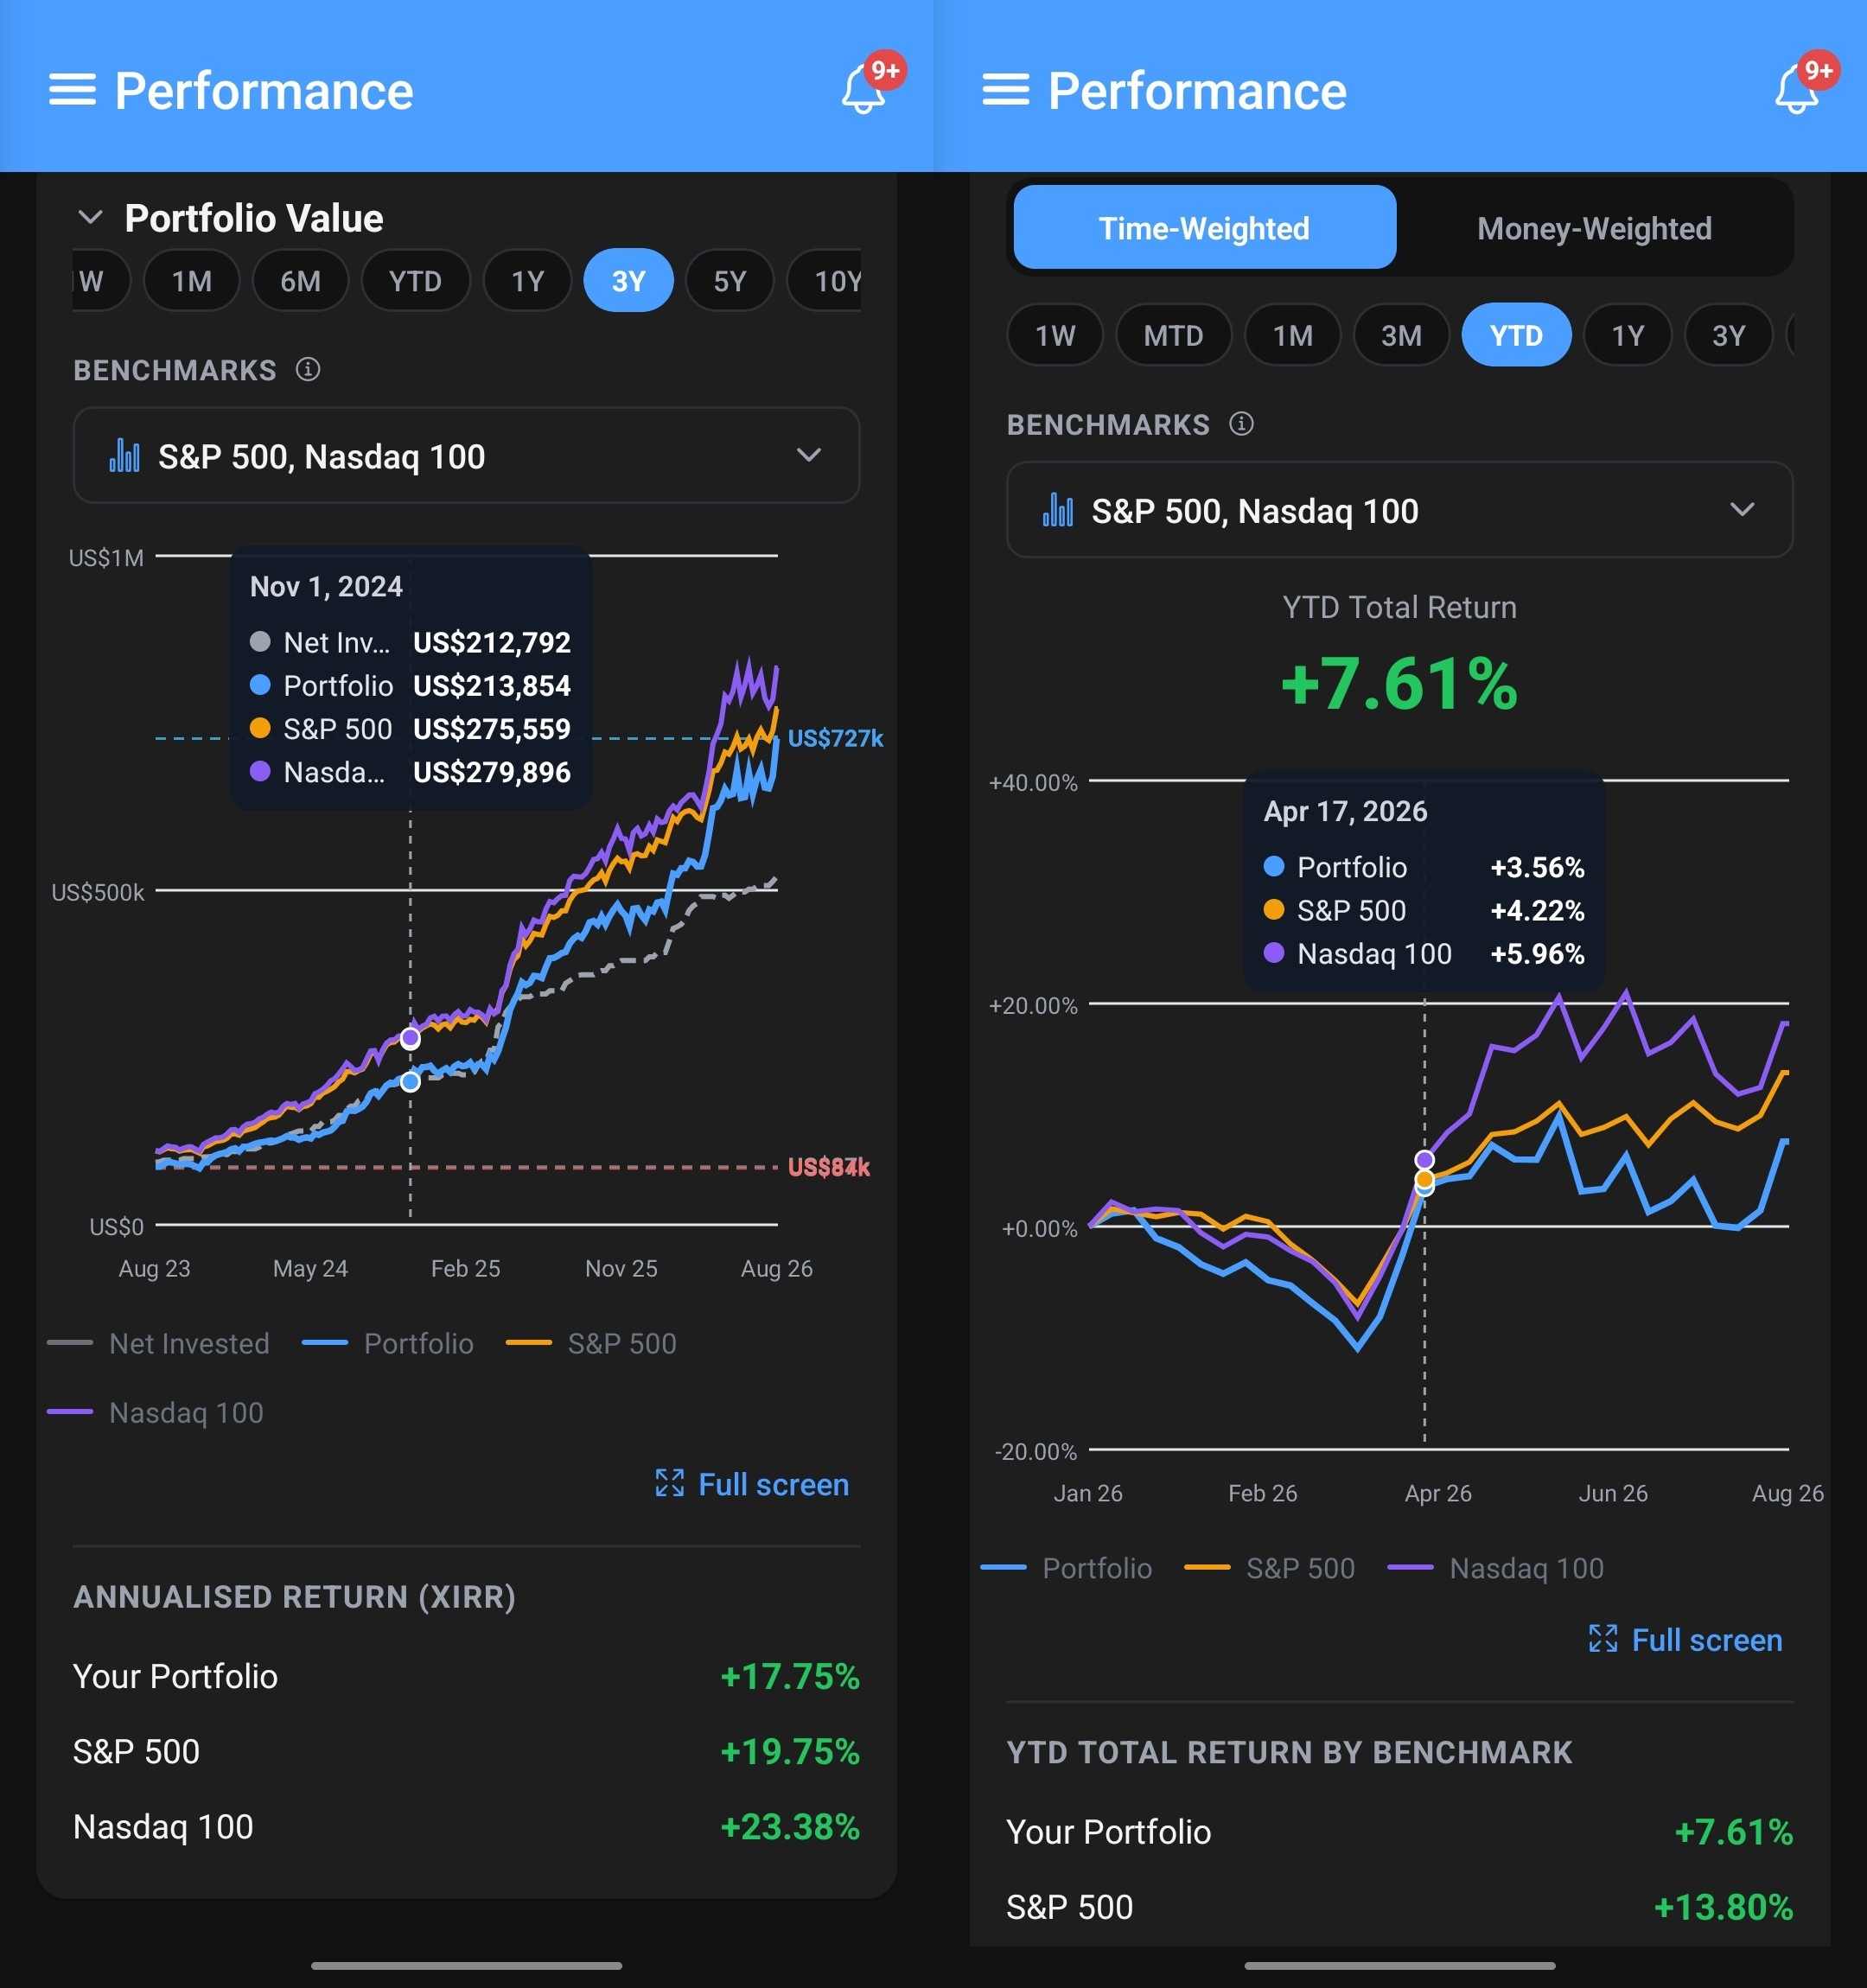
Time-weighted and money-weighted return, side by side

One chart shows your pure market performance (TWR) next to your actual annualized return given when you added or withdrew money (MWR/XIRR) — with a plain-language explainer built in. Most retail apps blend these into a single "return %" that answers neither question precisely.

Dividend income, net of the tax you actually paid

Per-country withholding-tax rates (Singapore, US, Japan, and more), editable if a rate changes or a new market isn't covered yet. Consumer apps typically show gross dividends and stop there.

Group your portfolio however you actually think about it

Define your own groupings — by country, by sector, by conviction level, whatever — instead of being stuck with one fixed taxonomy someone else chose for you.

No bank-credential aggregator, no company server

Your data lives on your device. No Plaid-style account linking, no financial data sitting on a server we operate. If you want a backup, it goes to your own Google Drive — we never see it.

Finances

Your everyday money, in the same picture as your investments

Income, expenses, and account balances — with every trade and dividend from Investments folded straight into the same ledger.

One net worth number, not two apps

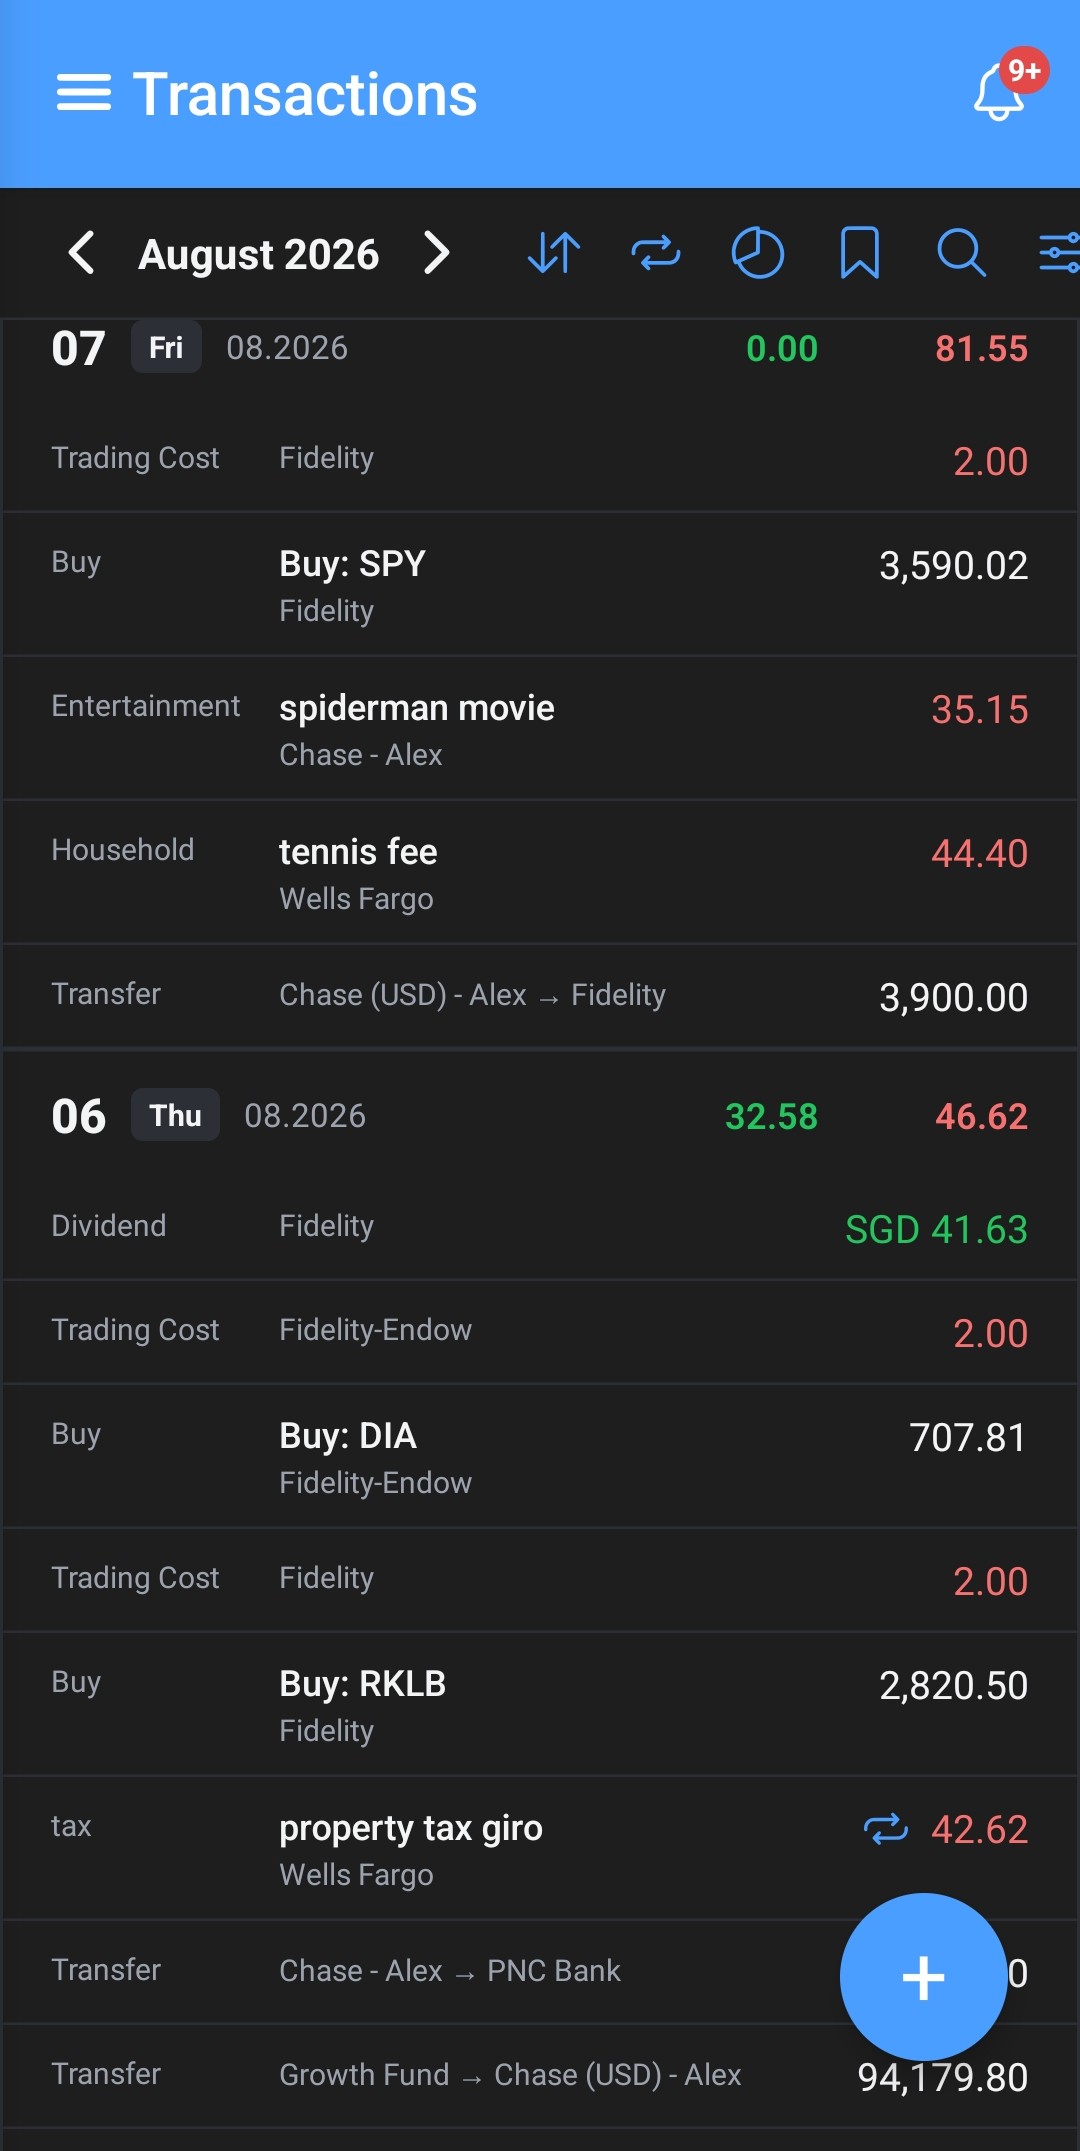
Every buy, sell, dividend, and trading cost from Investments posts automatically into your Finances ledger — so your net worth reflects your whole financial life, not just your bank balance.

ScreenshotNet Worth Stats — Cash Flow tab with savings-rate overlay

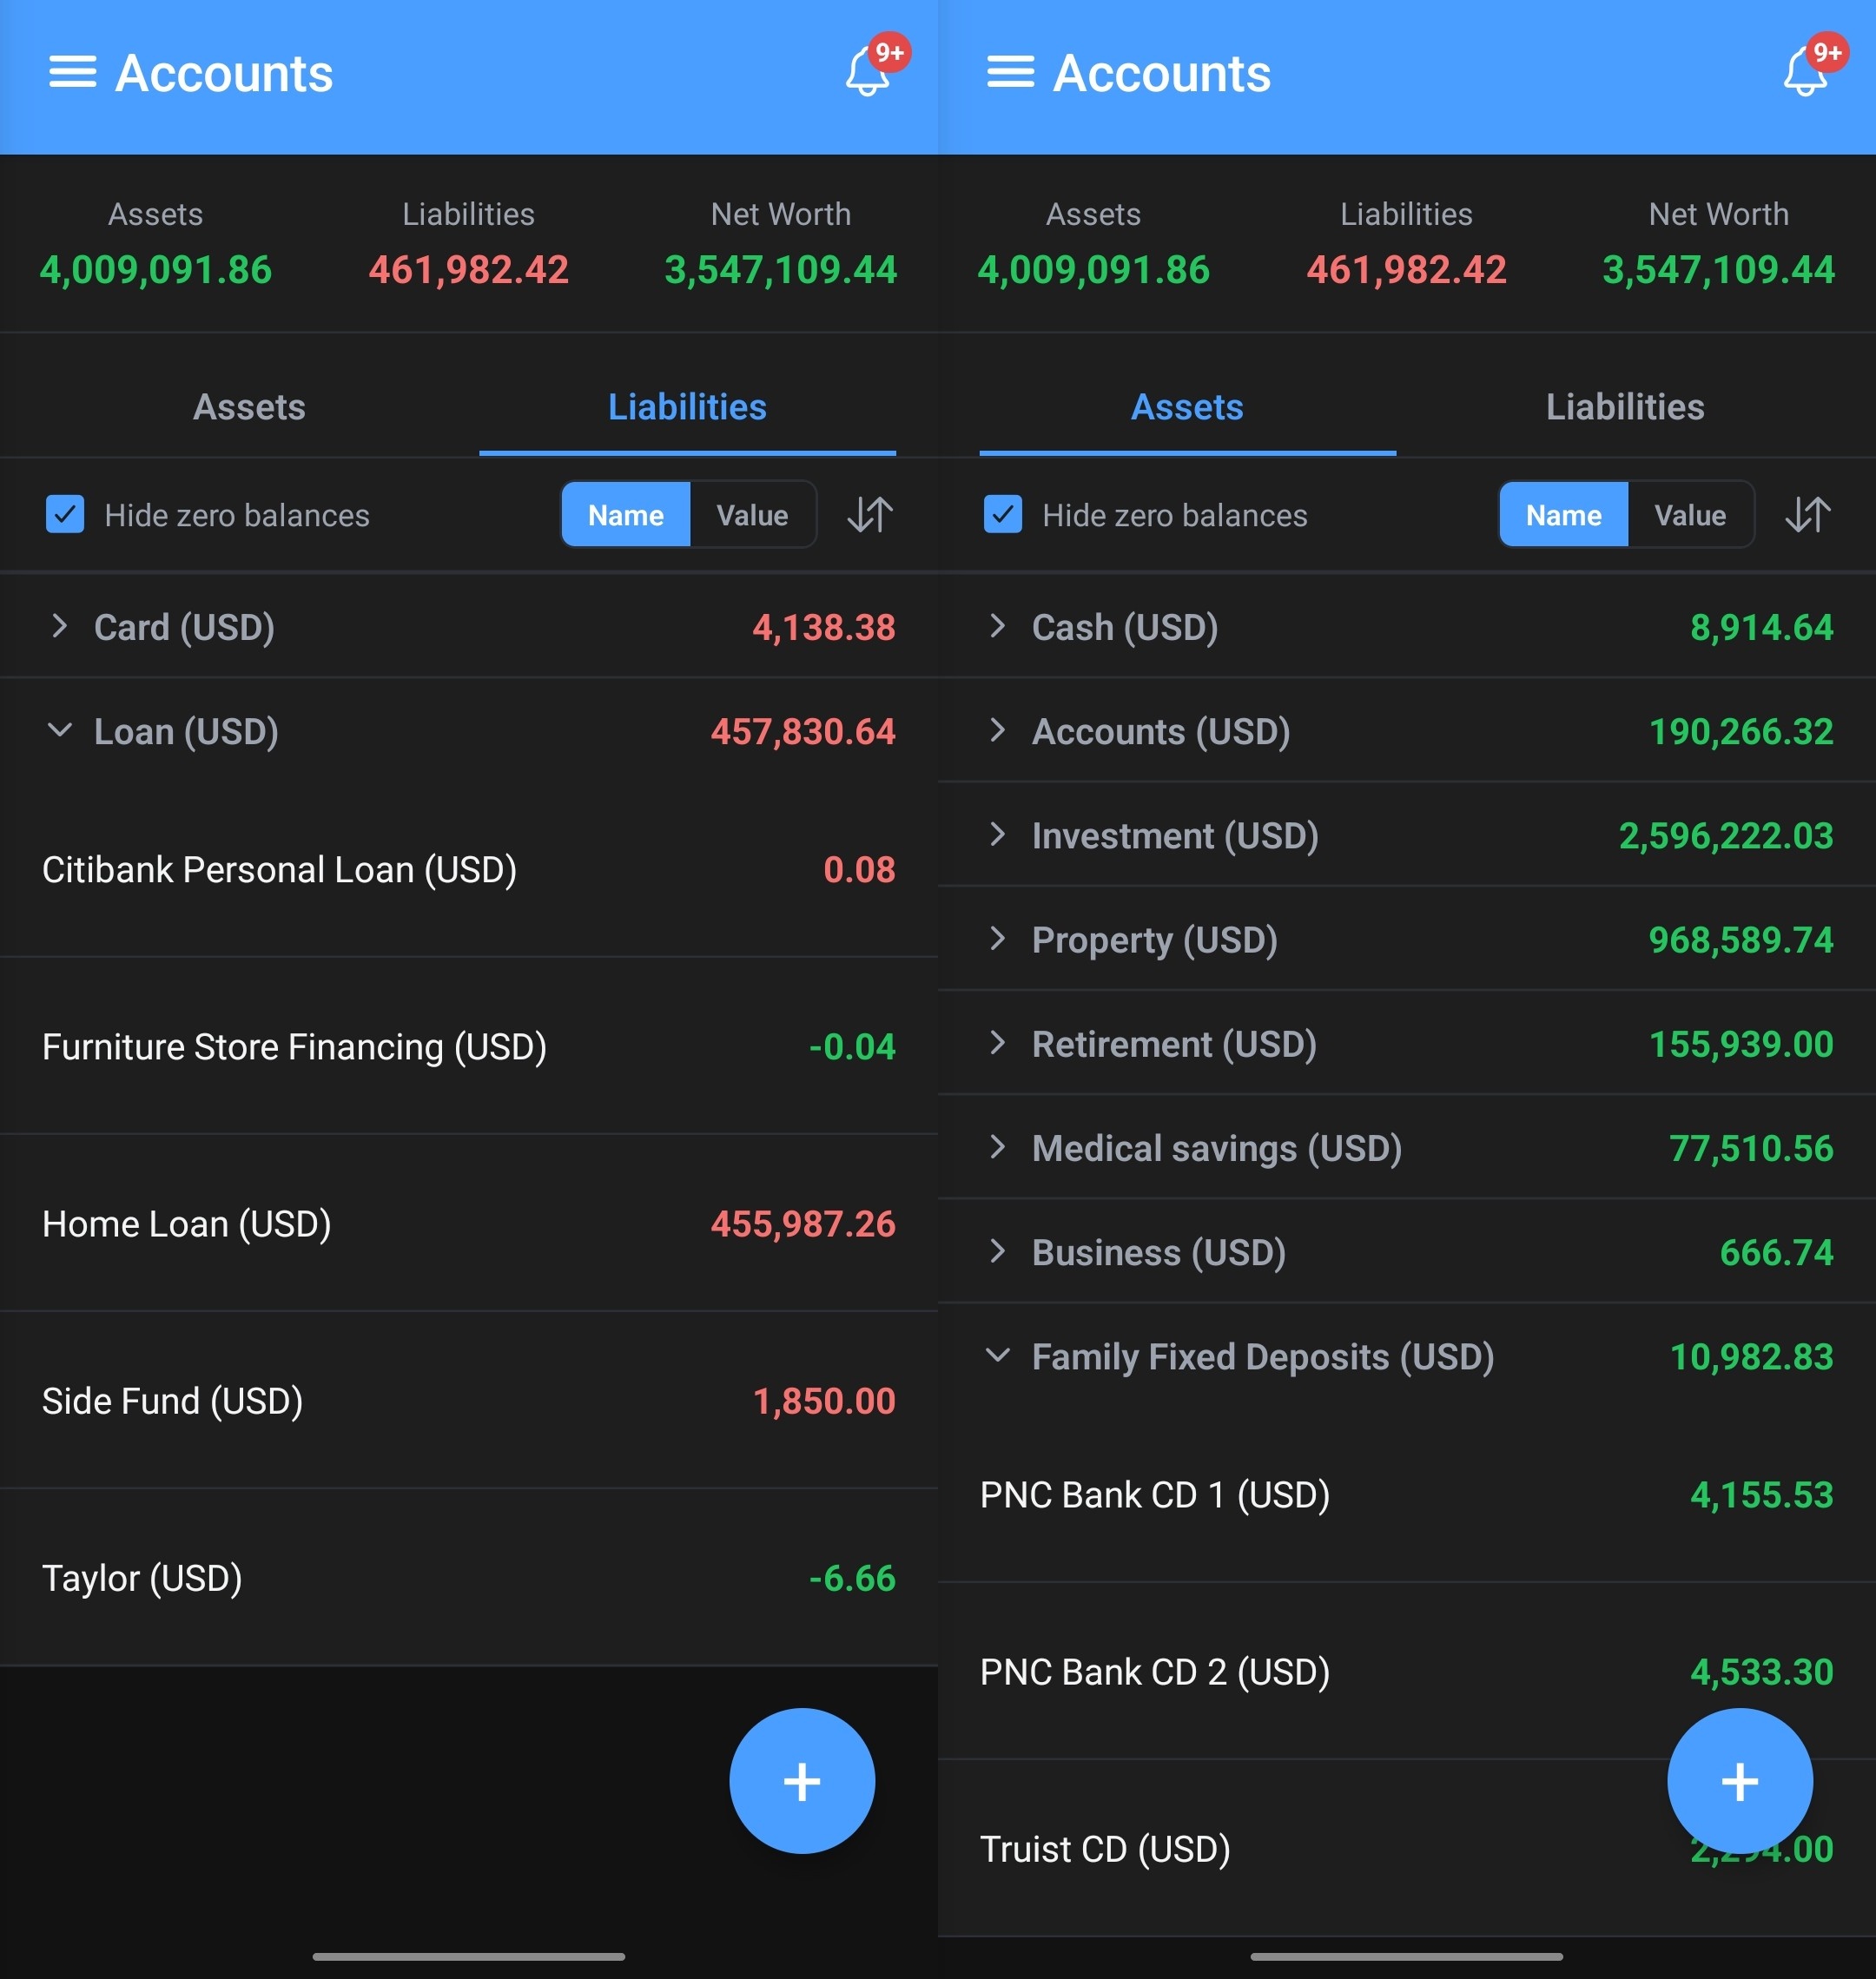
Accounts, grouped your way

Group accounts however makes sense to you, split Assets from Liabilities, hide zero-balance accounts, and correct a balance with a backdated entry instead of silently overwriting history.

ScreenshotAccounts screen — grouped, Assets/Liabilities tabs

Import a spreadsheet, skip the data entry

Bulk-import transactions from Excel with fuzzy broker and account-name matching, automatic date-format detection, and clear per-row error reporting if something doesn't match.

ScreenshotExcel import — matched rows and error report
Investments

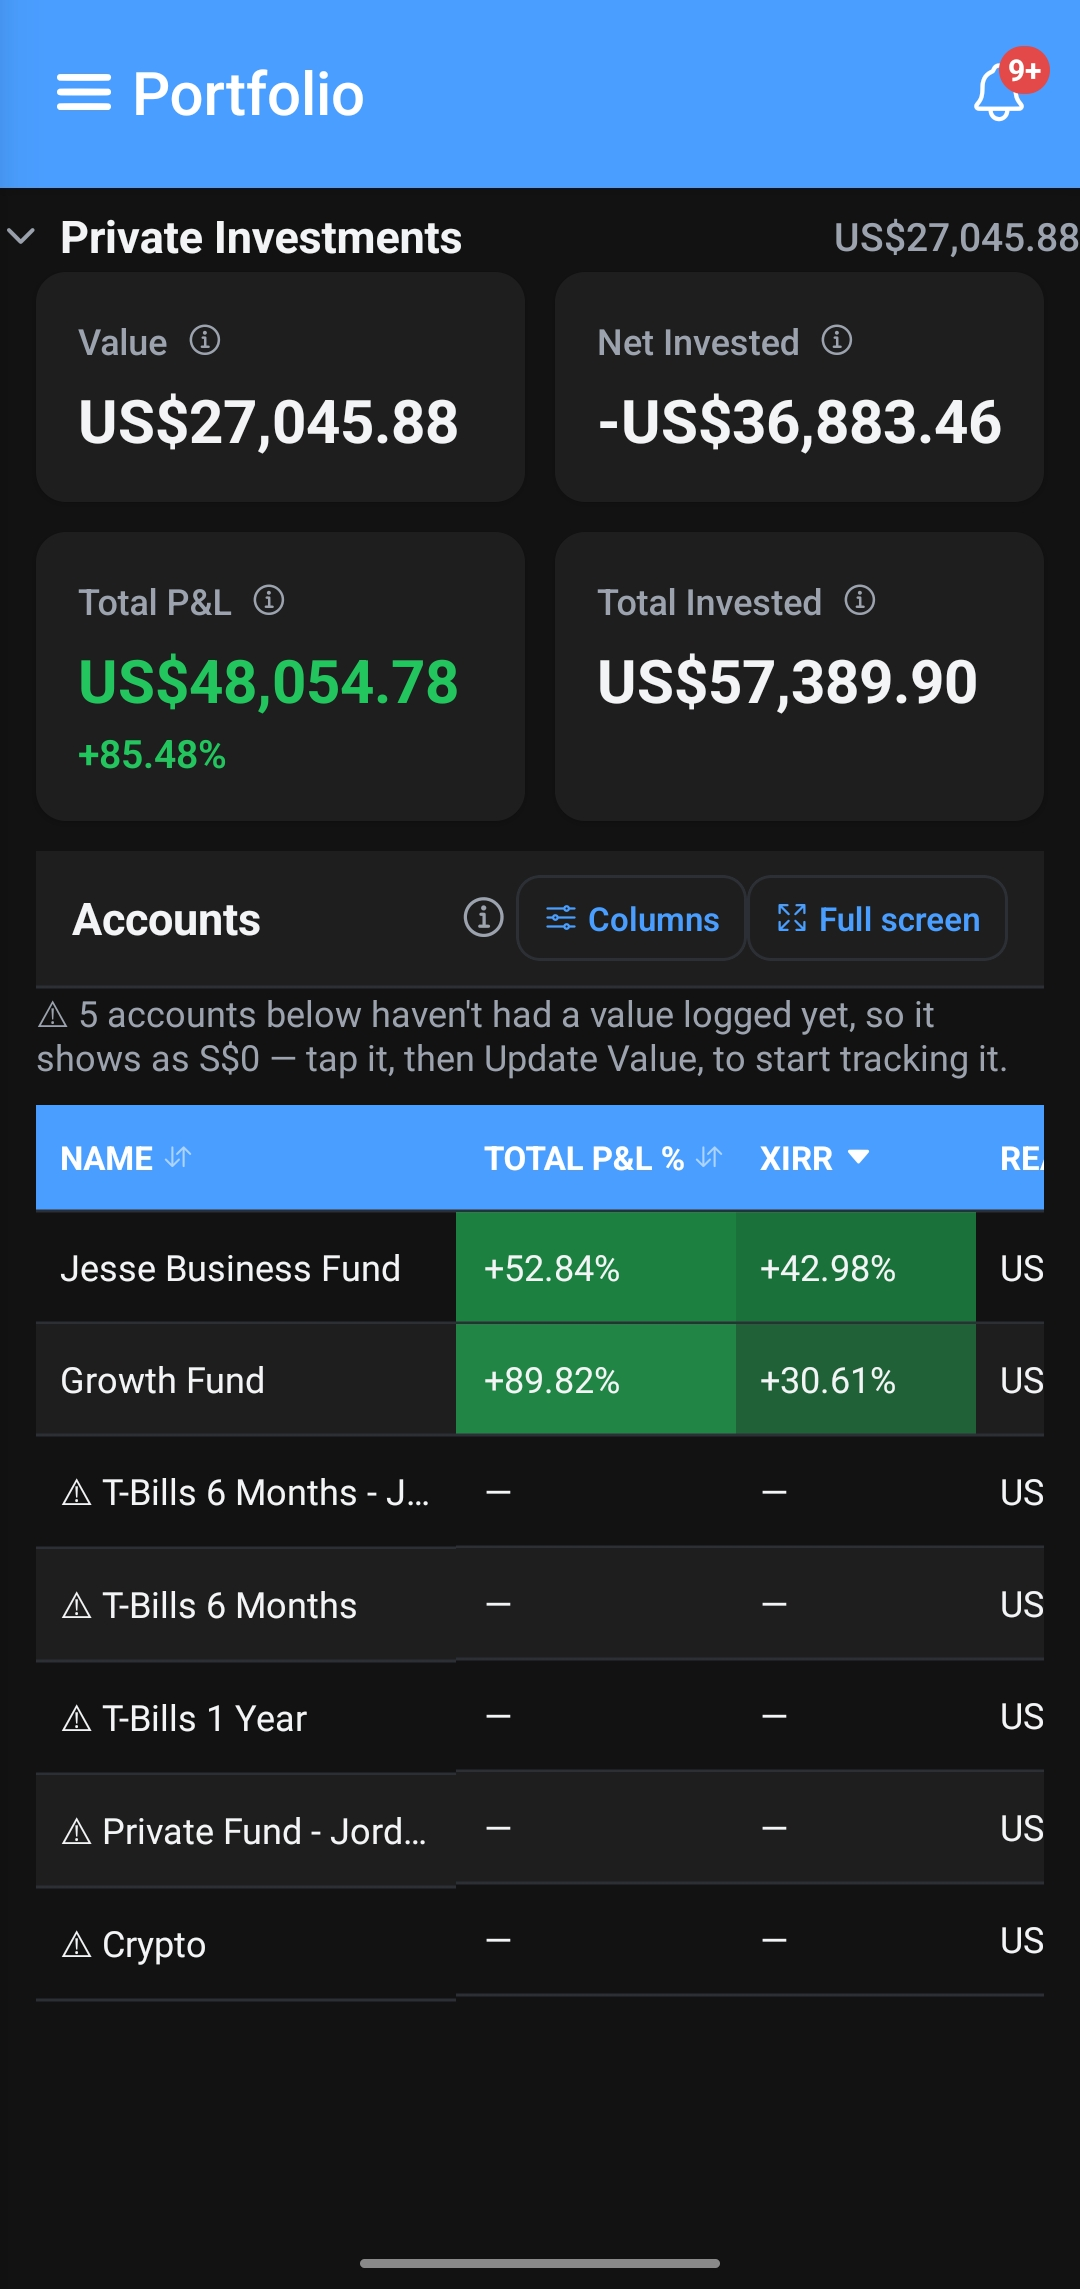
Every brokerage account, one portfolio

The part most trackers get wrong: consolidating multiple brokers into real numbers, not just a longer list of accounts.

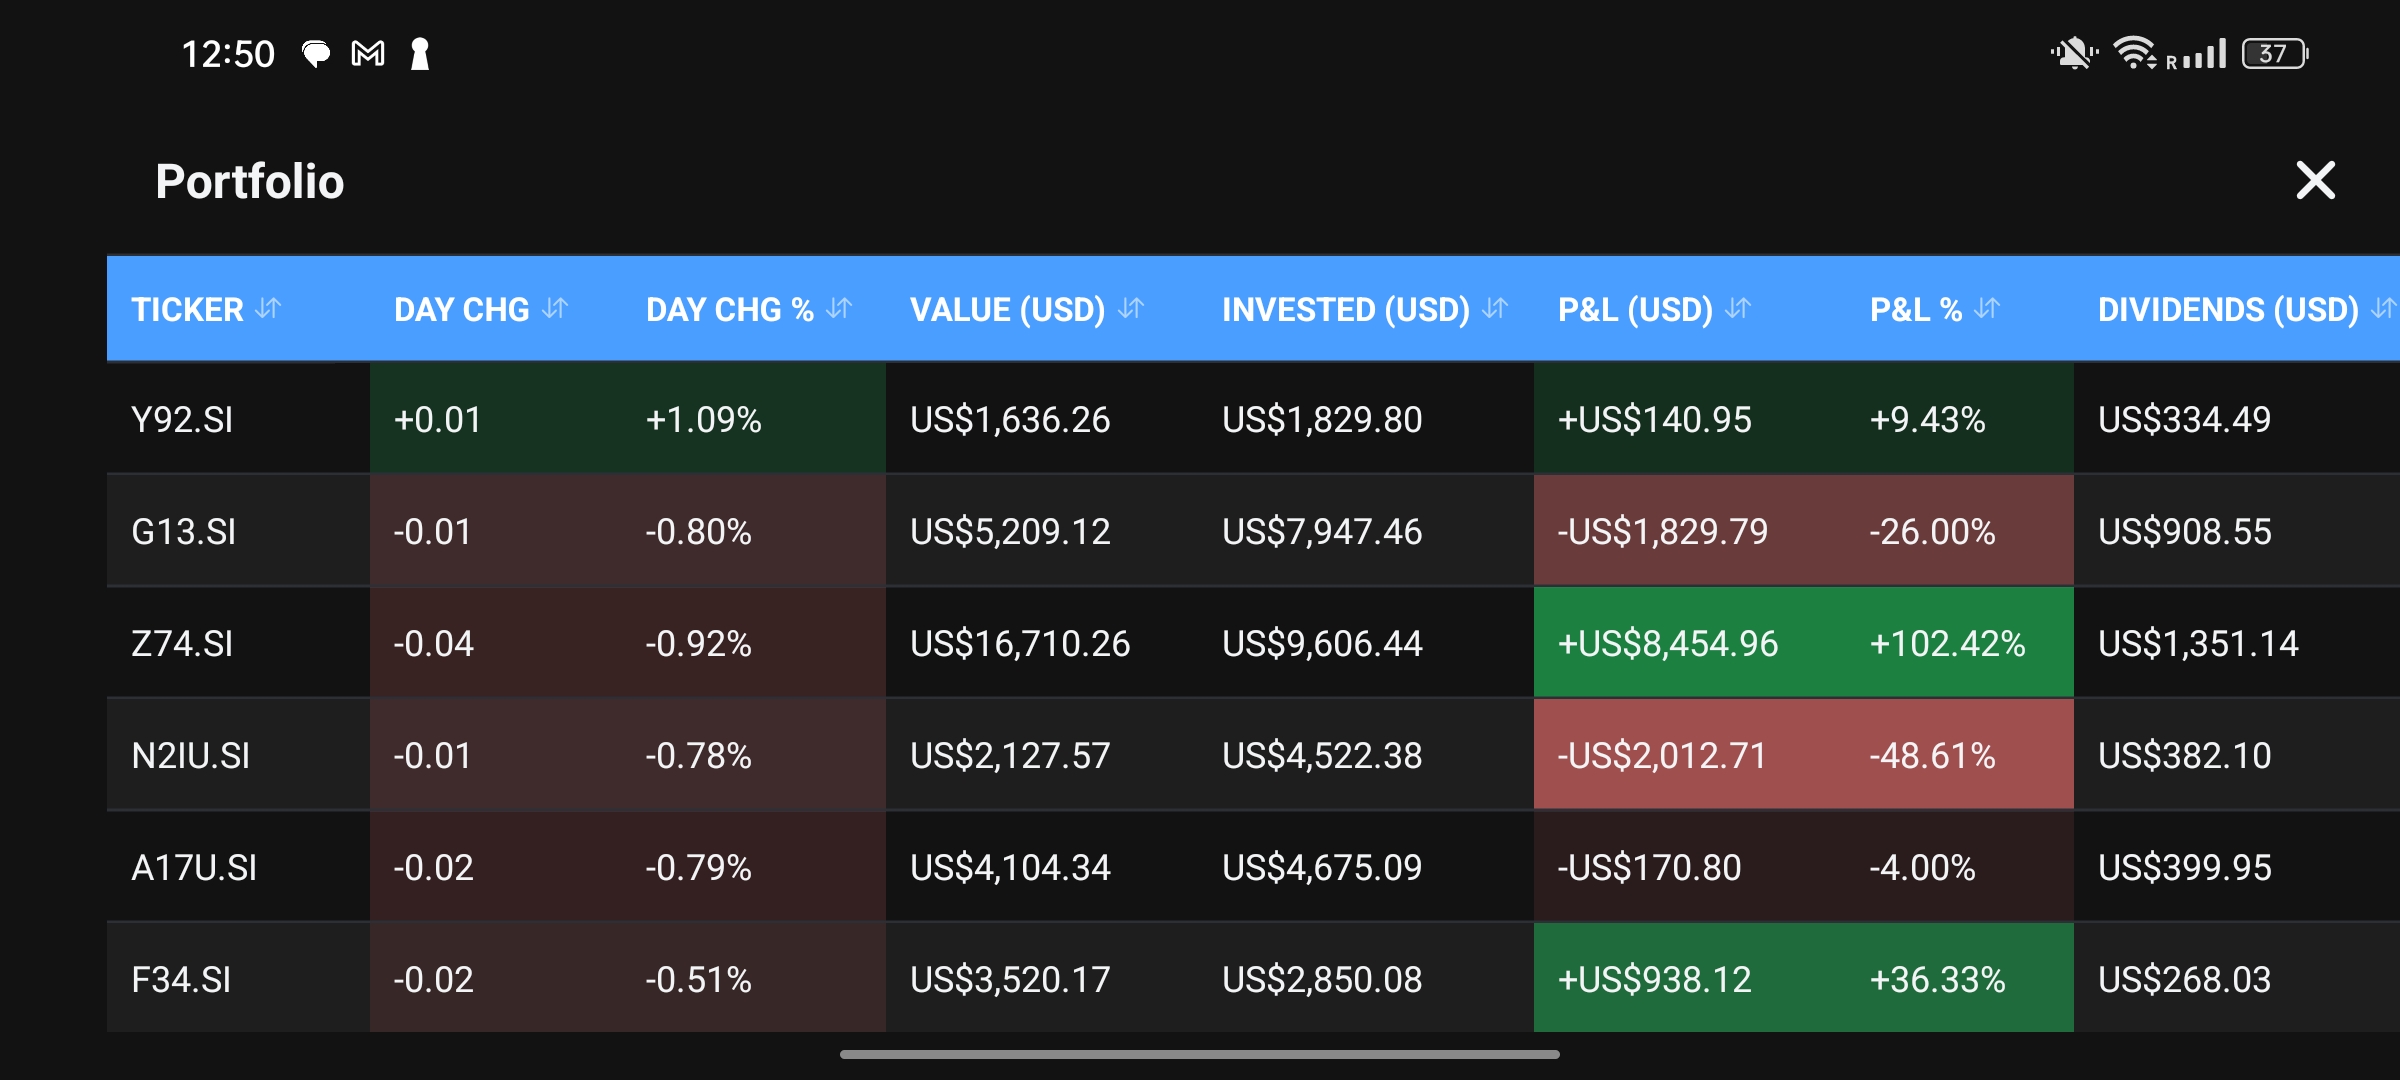
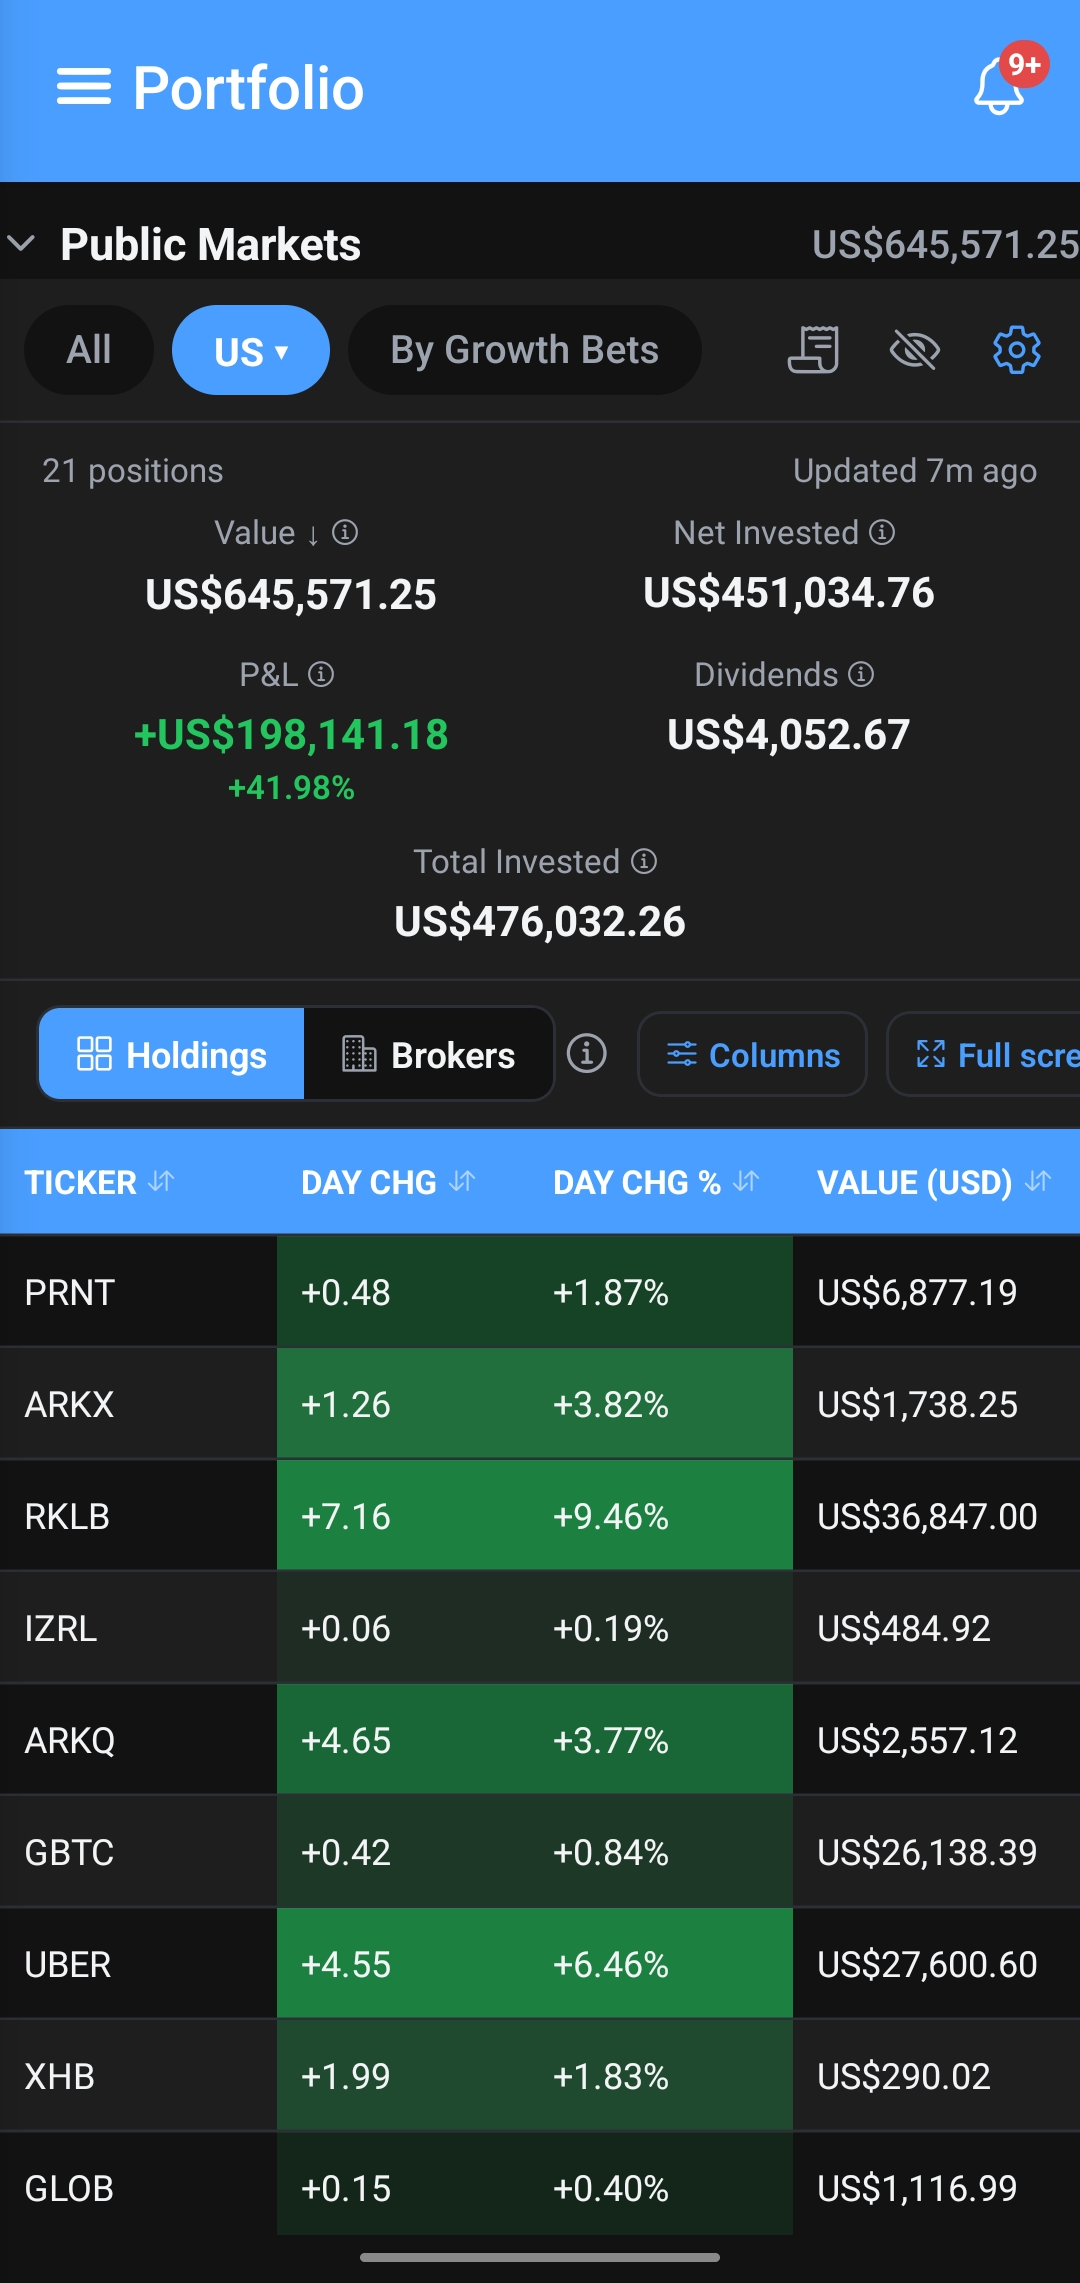
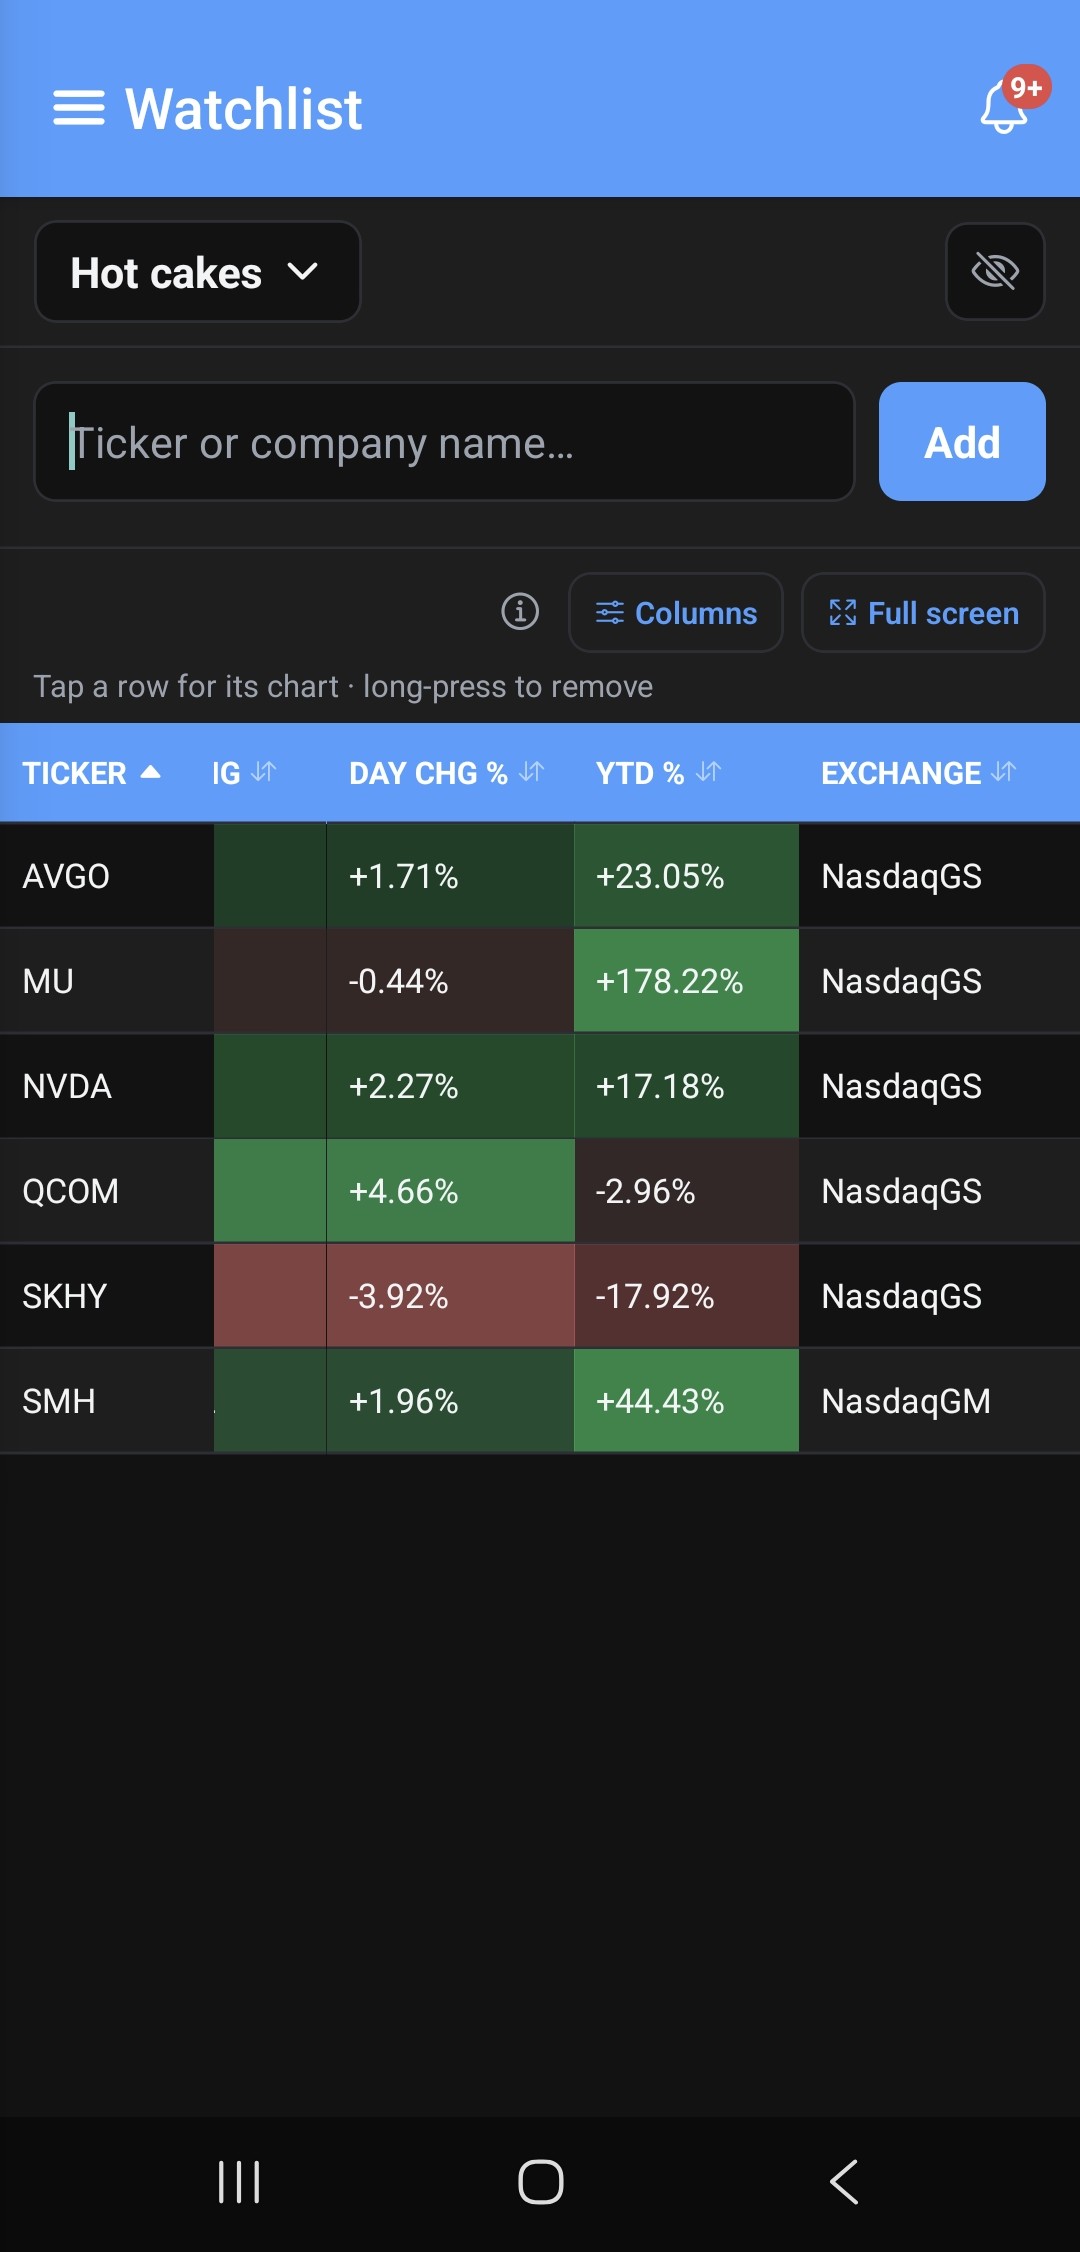
A heatmap, not just a table

Sortable, customizable columns — day/YTD change, high/low, volume, exchange — with a color-coded P&L heatmap across your whole portfolio at a glance. Switch between List and Table layouts; your column choices persist.

ScreenshotPortfolio table view — P&L heatmap columns

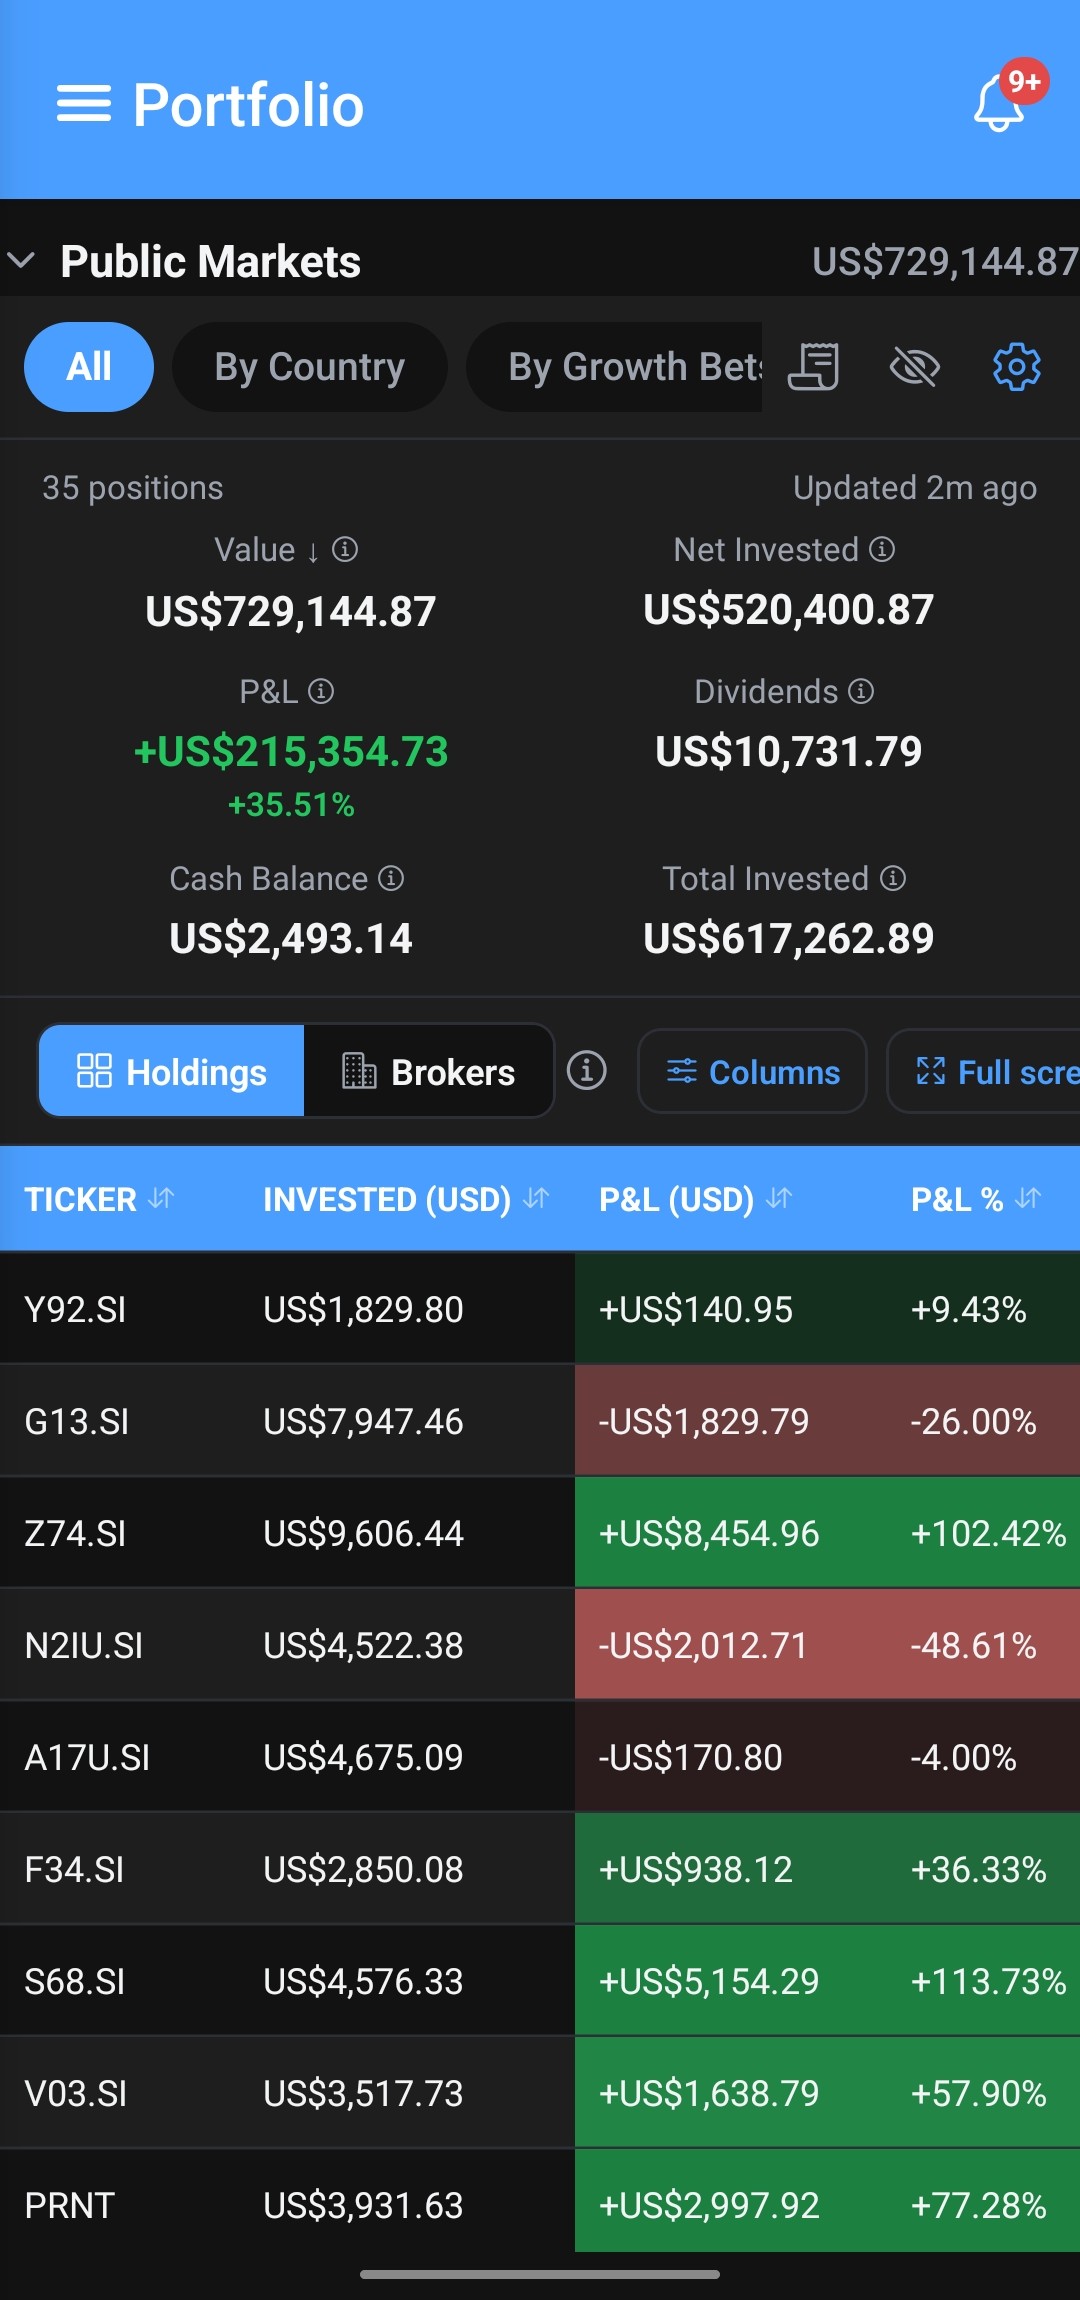
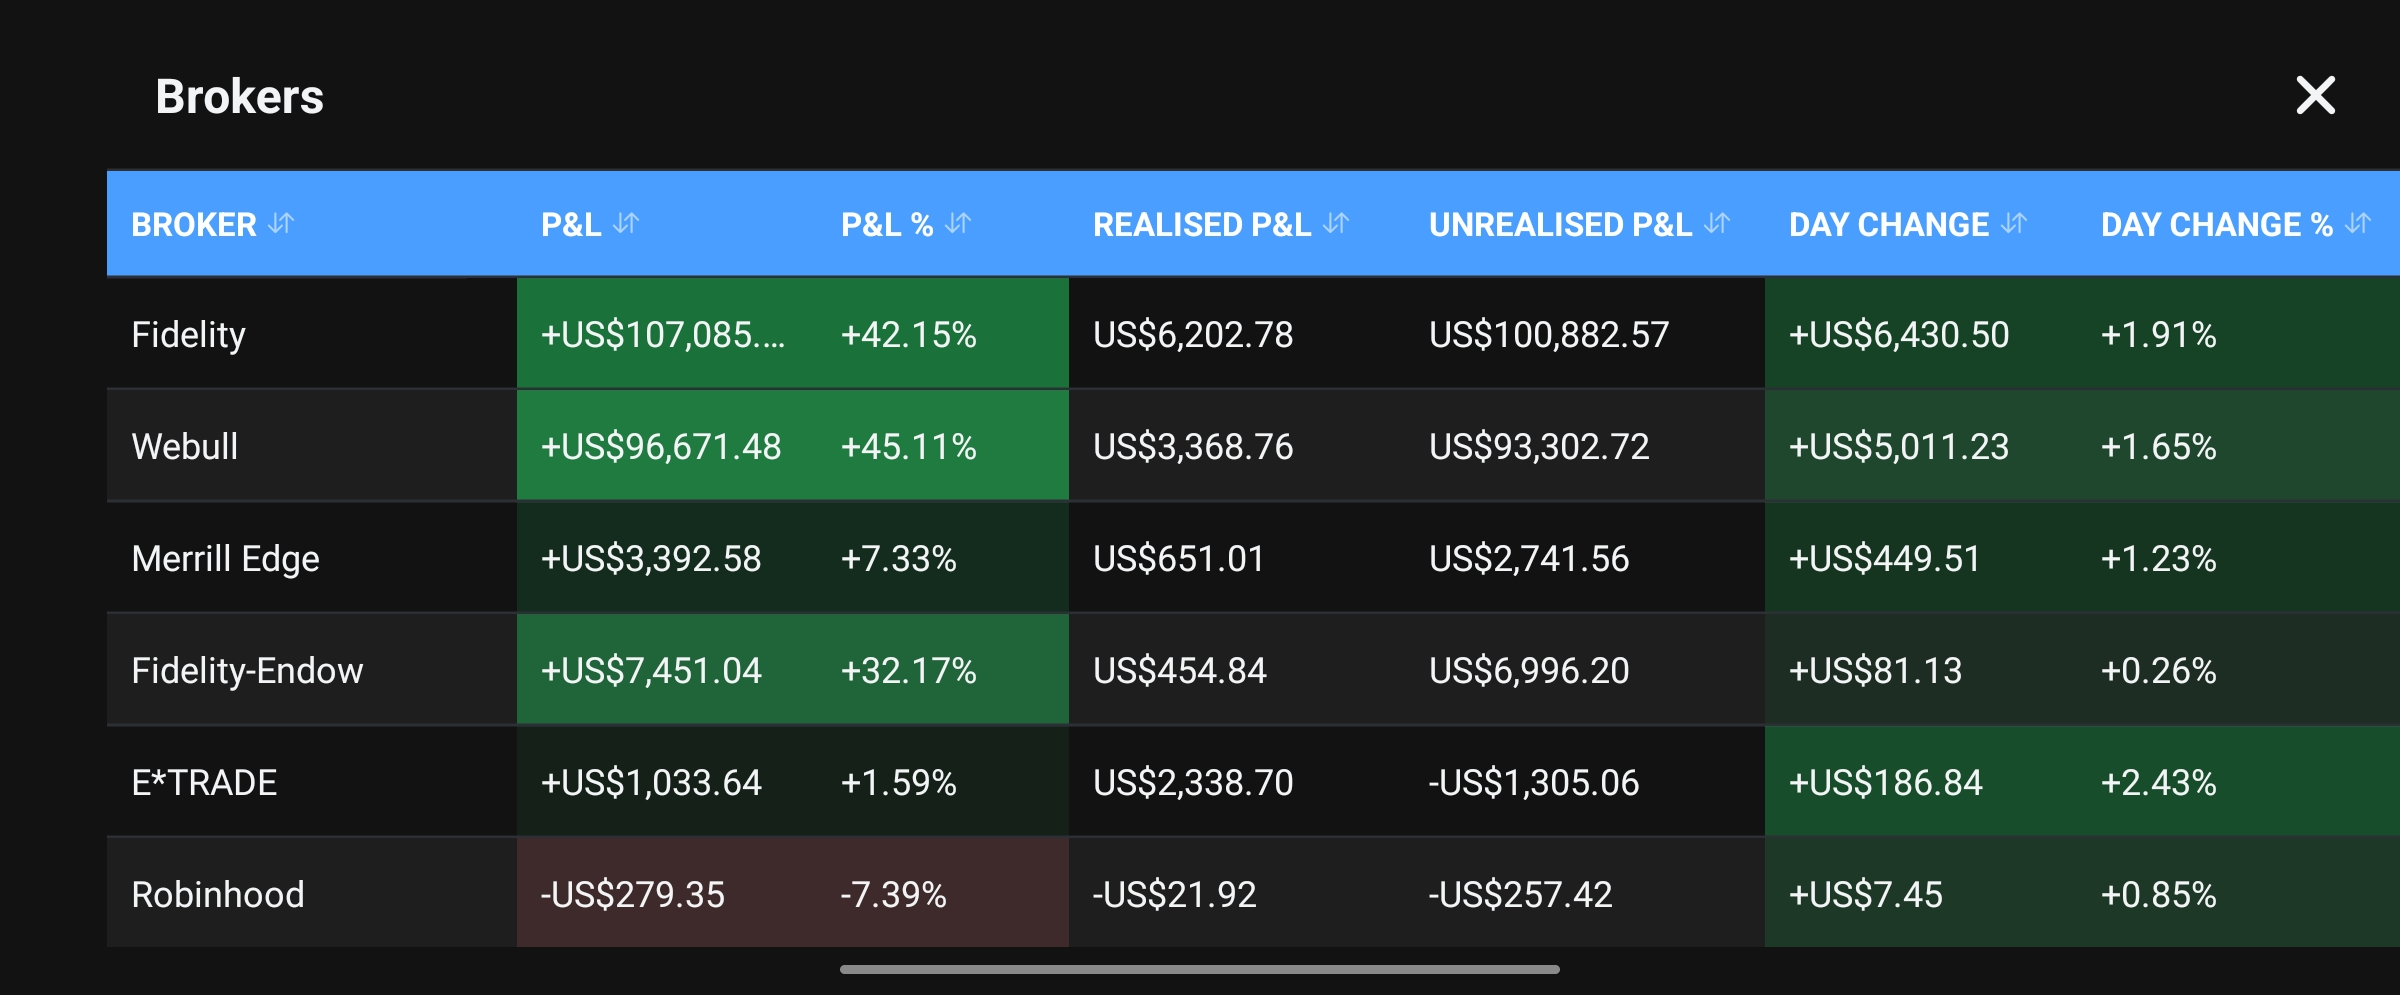
Realised and unrealised, kept separate

Dollar and percent columns for both, with dividends folded into realised P&L — so you can see what you've actually banked versus what's still on paper.

ScreenshotPortfolio — Realised/Unrealised P&L columns

Benchmark yourself against the market you actually care about

S&P 500, Nasdaq, FTSE, STI, and regional indices across Europe, Asia-Pacific, and emerging markets — overlaid on your own performance chart with 1/3/5-year range views.

ScreenshotPerformance chart — TWR/MWR toggle with benchmark overlay

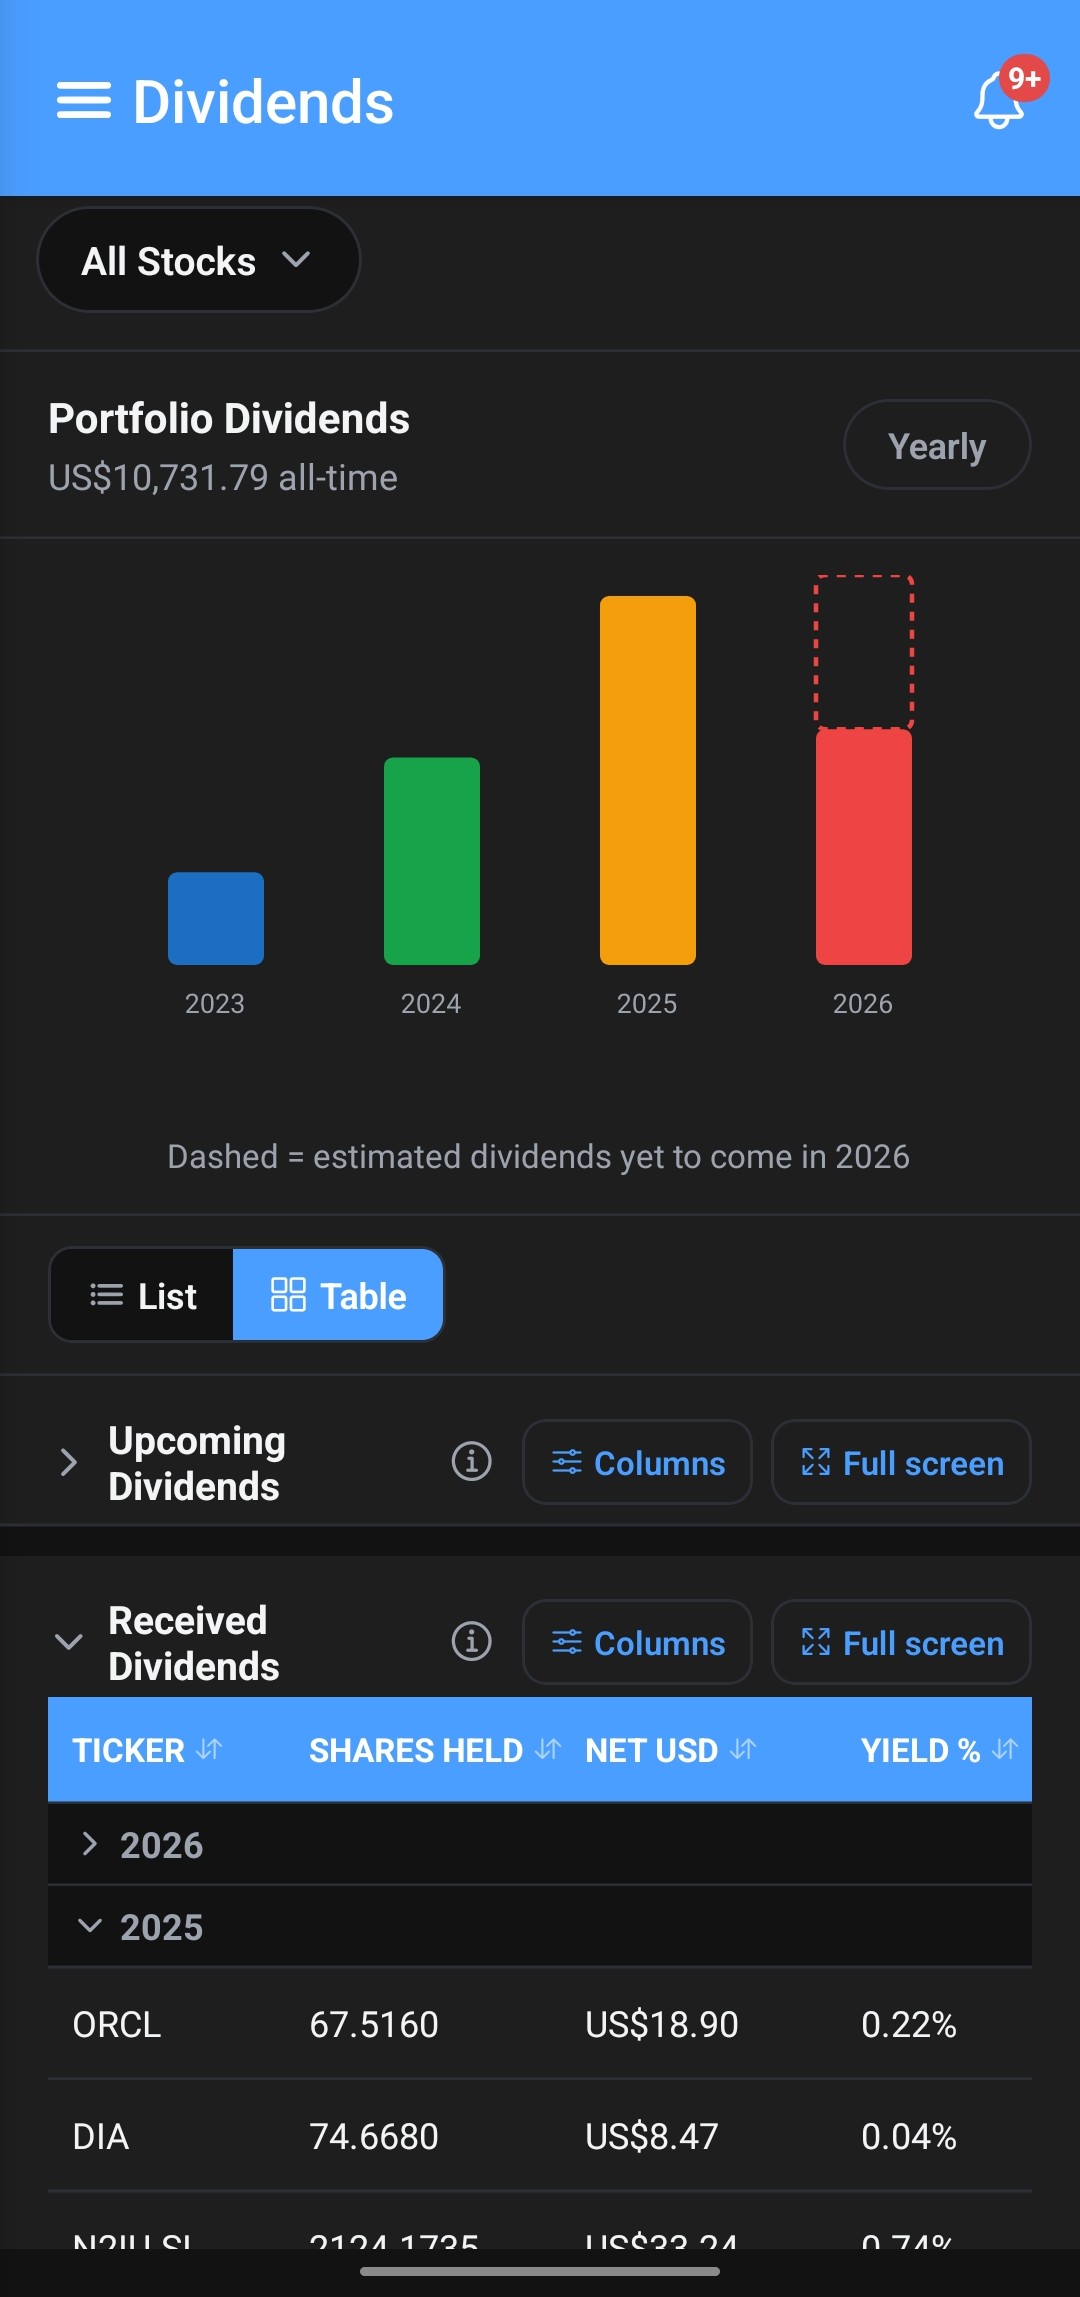
Dividends, received and upcoming

Per-ticker cumulative totals, projected next-payment dates based on historical cadence, and net-of-withholding-tax figures throughout.

ScreenshotDividends — received/upcoming tables

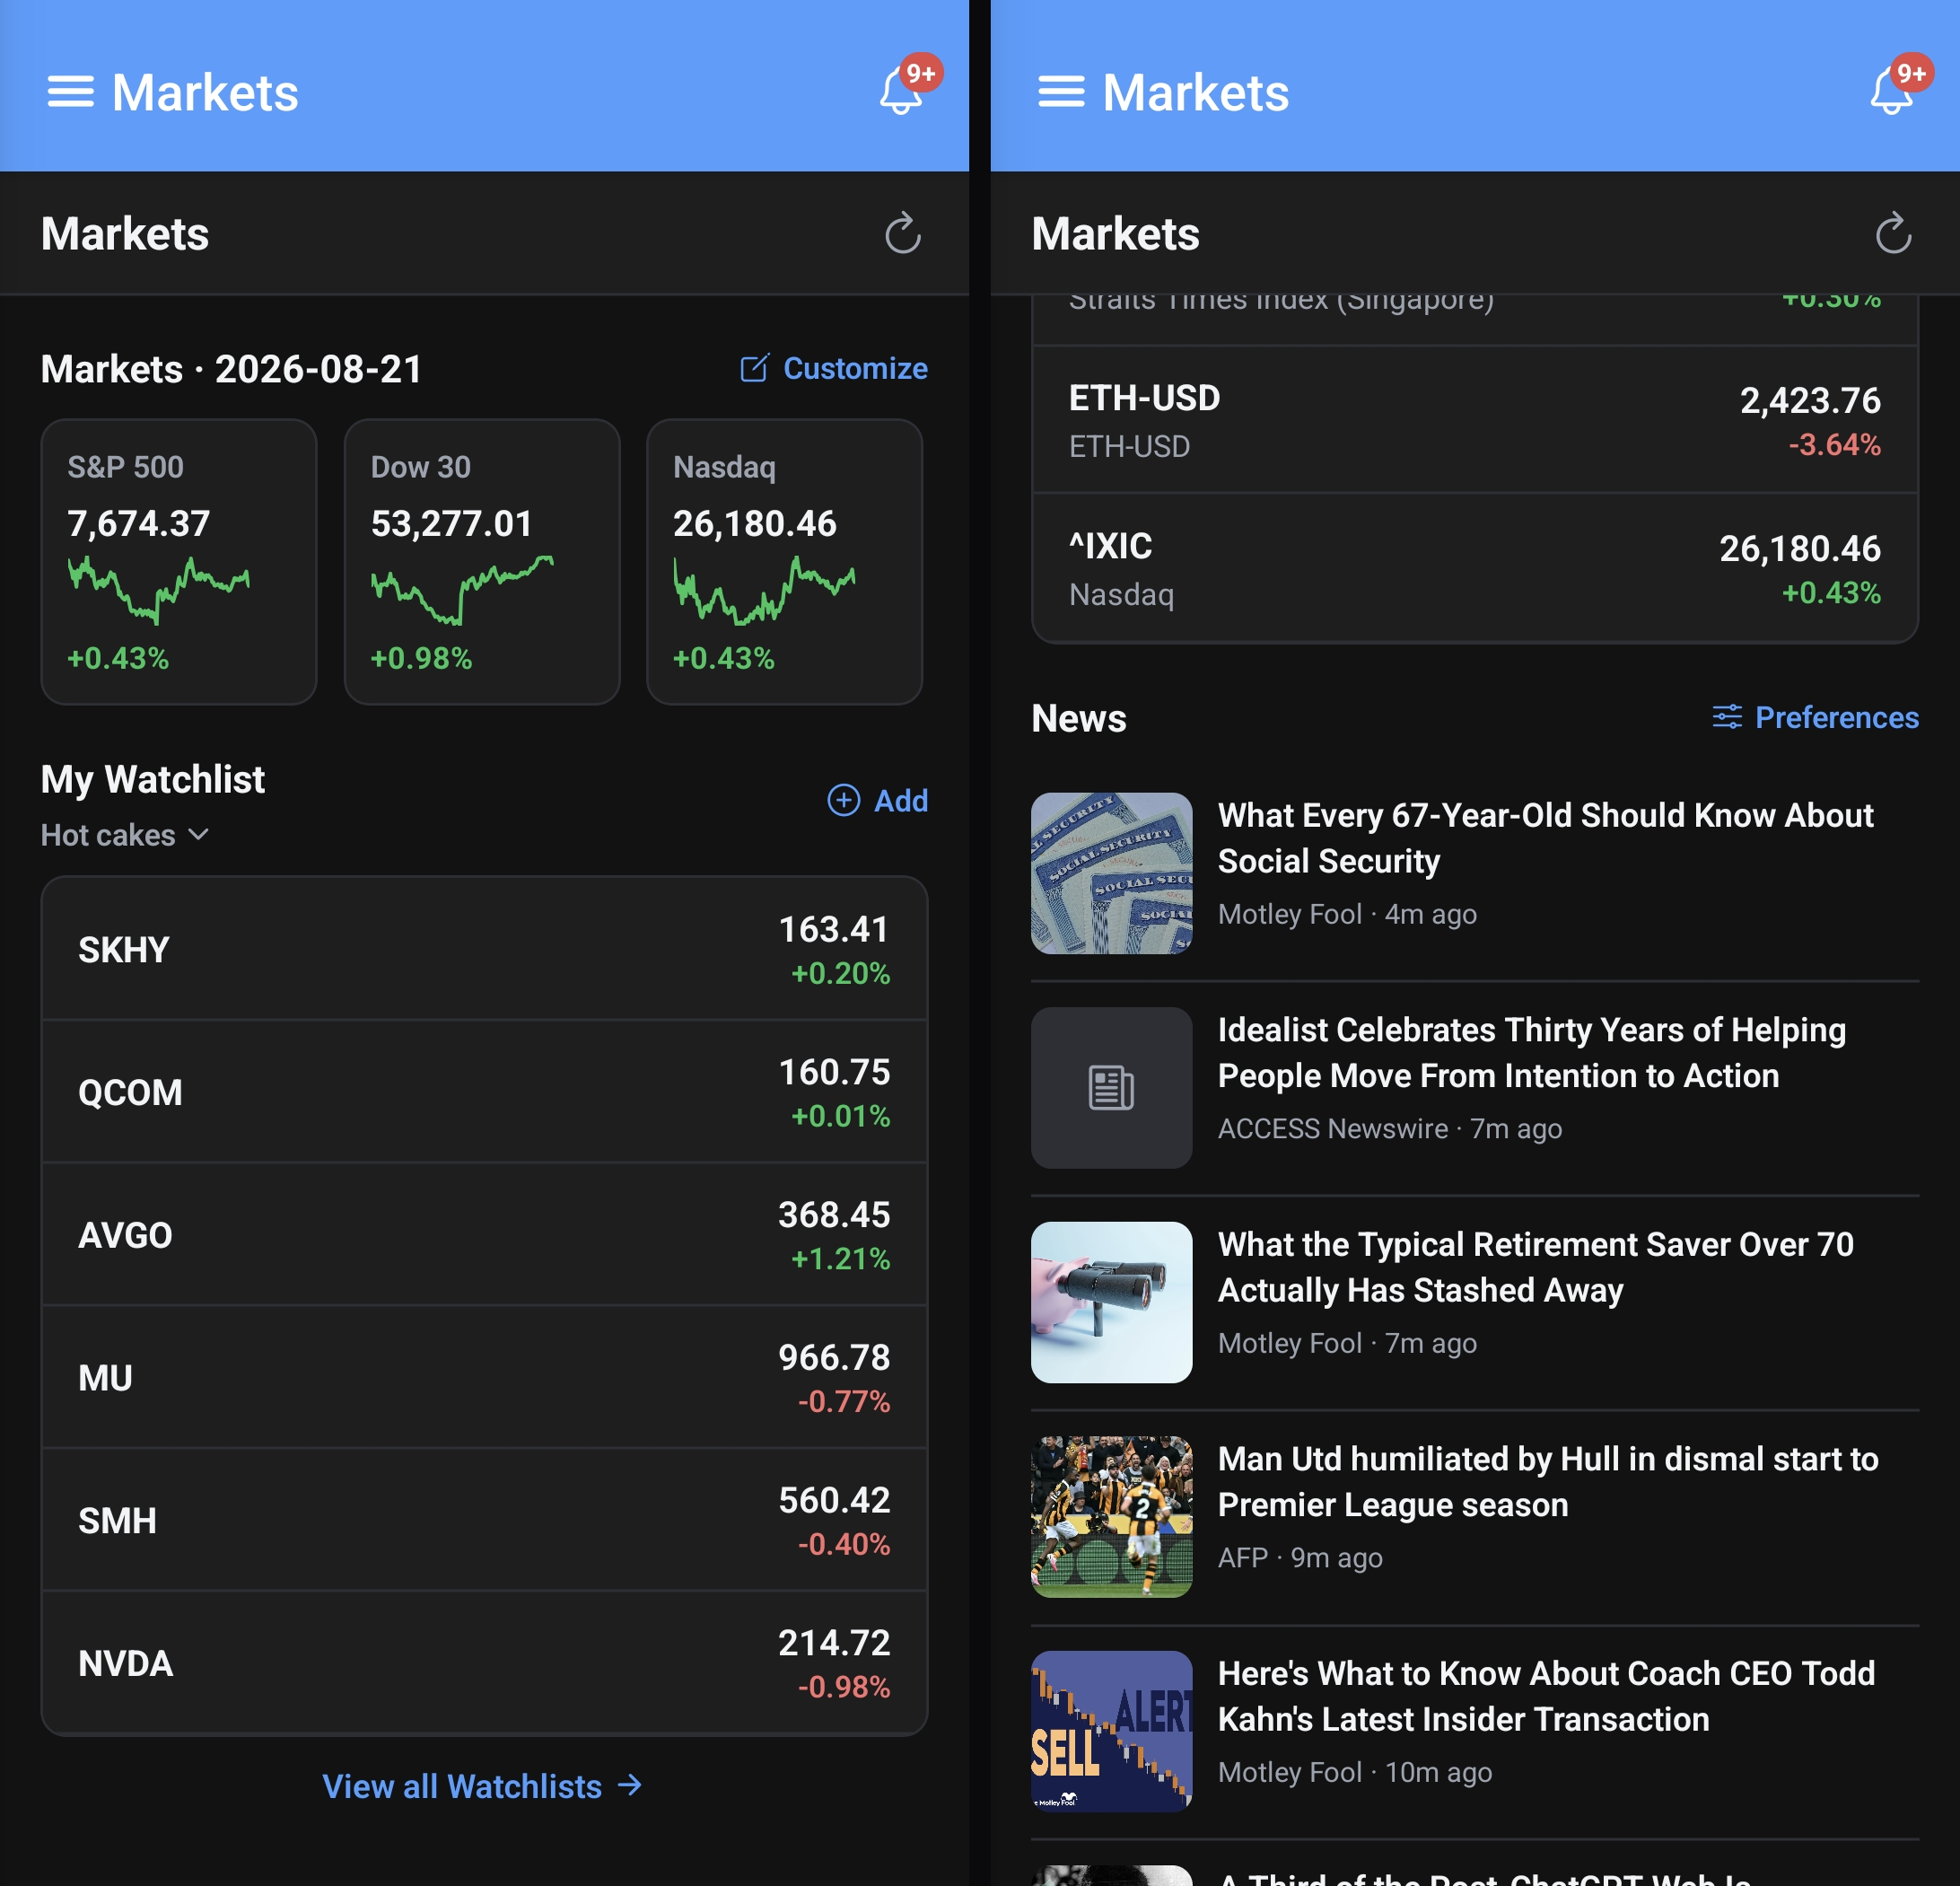
Watchlists that are actually charts

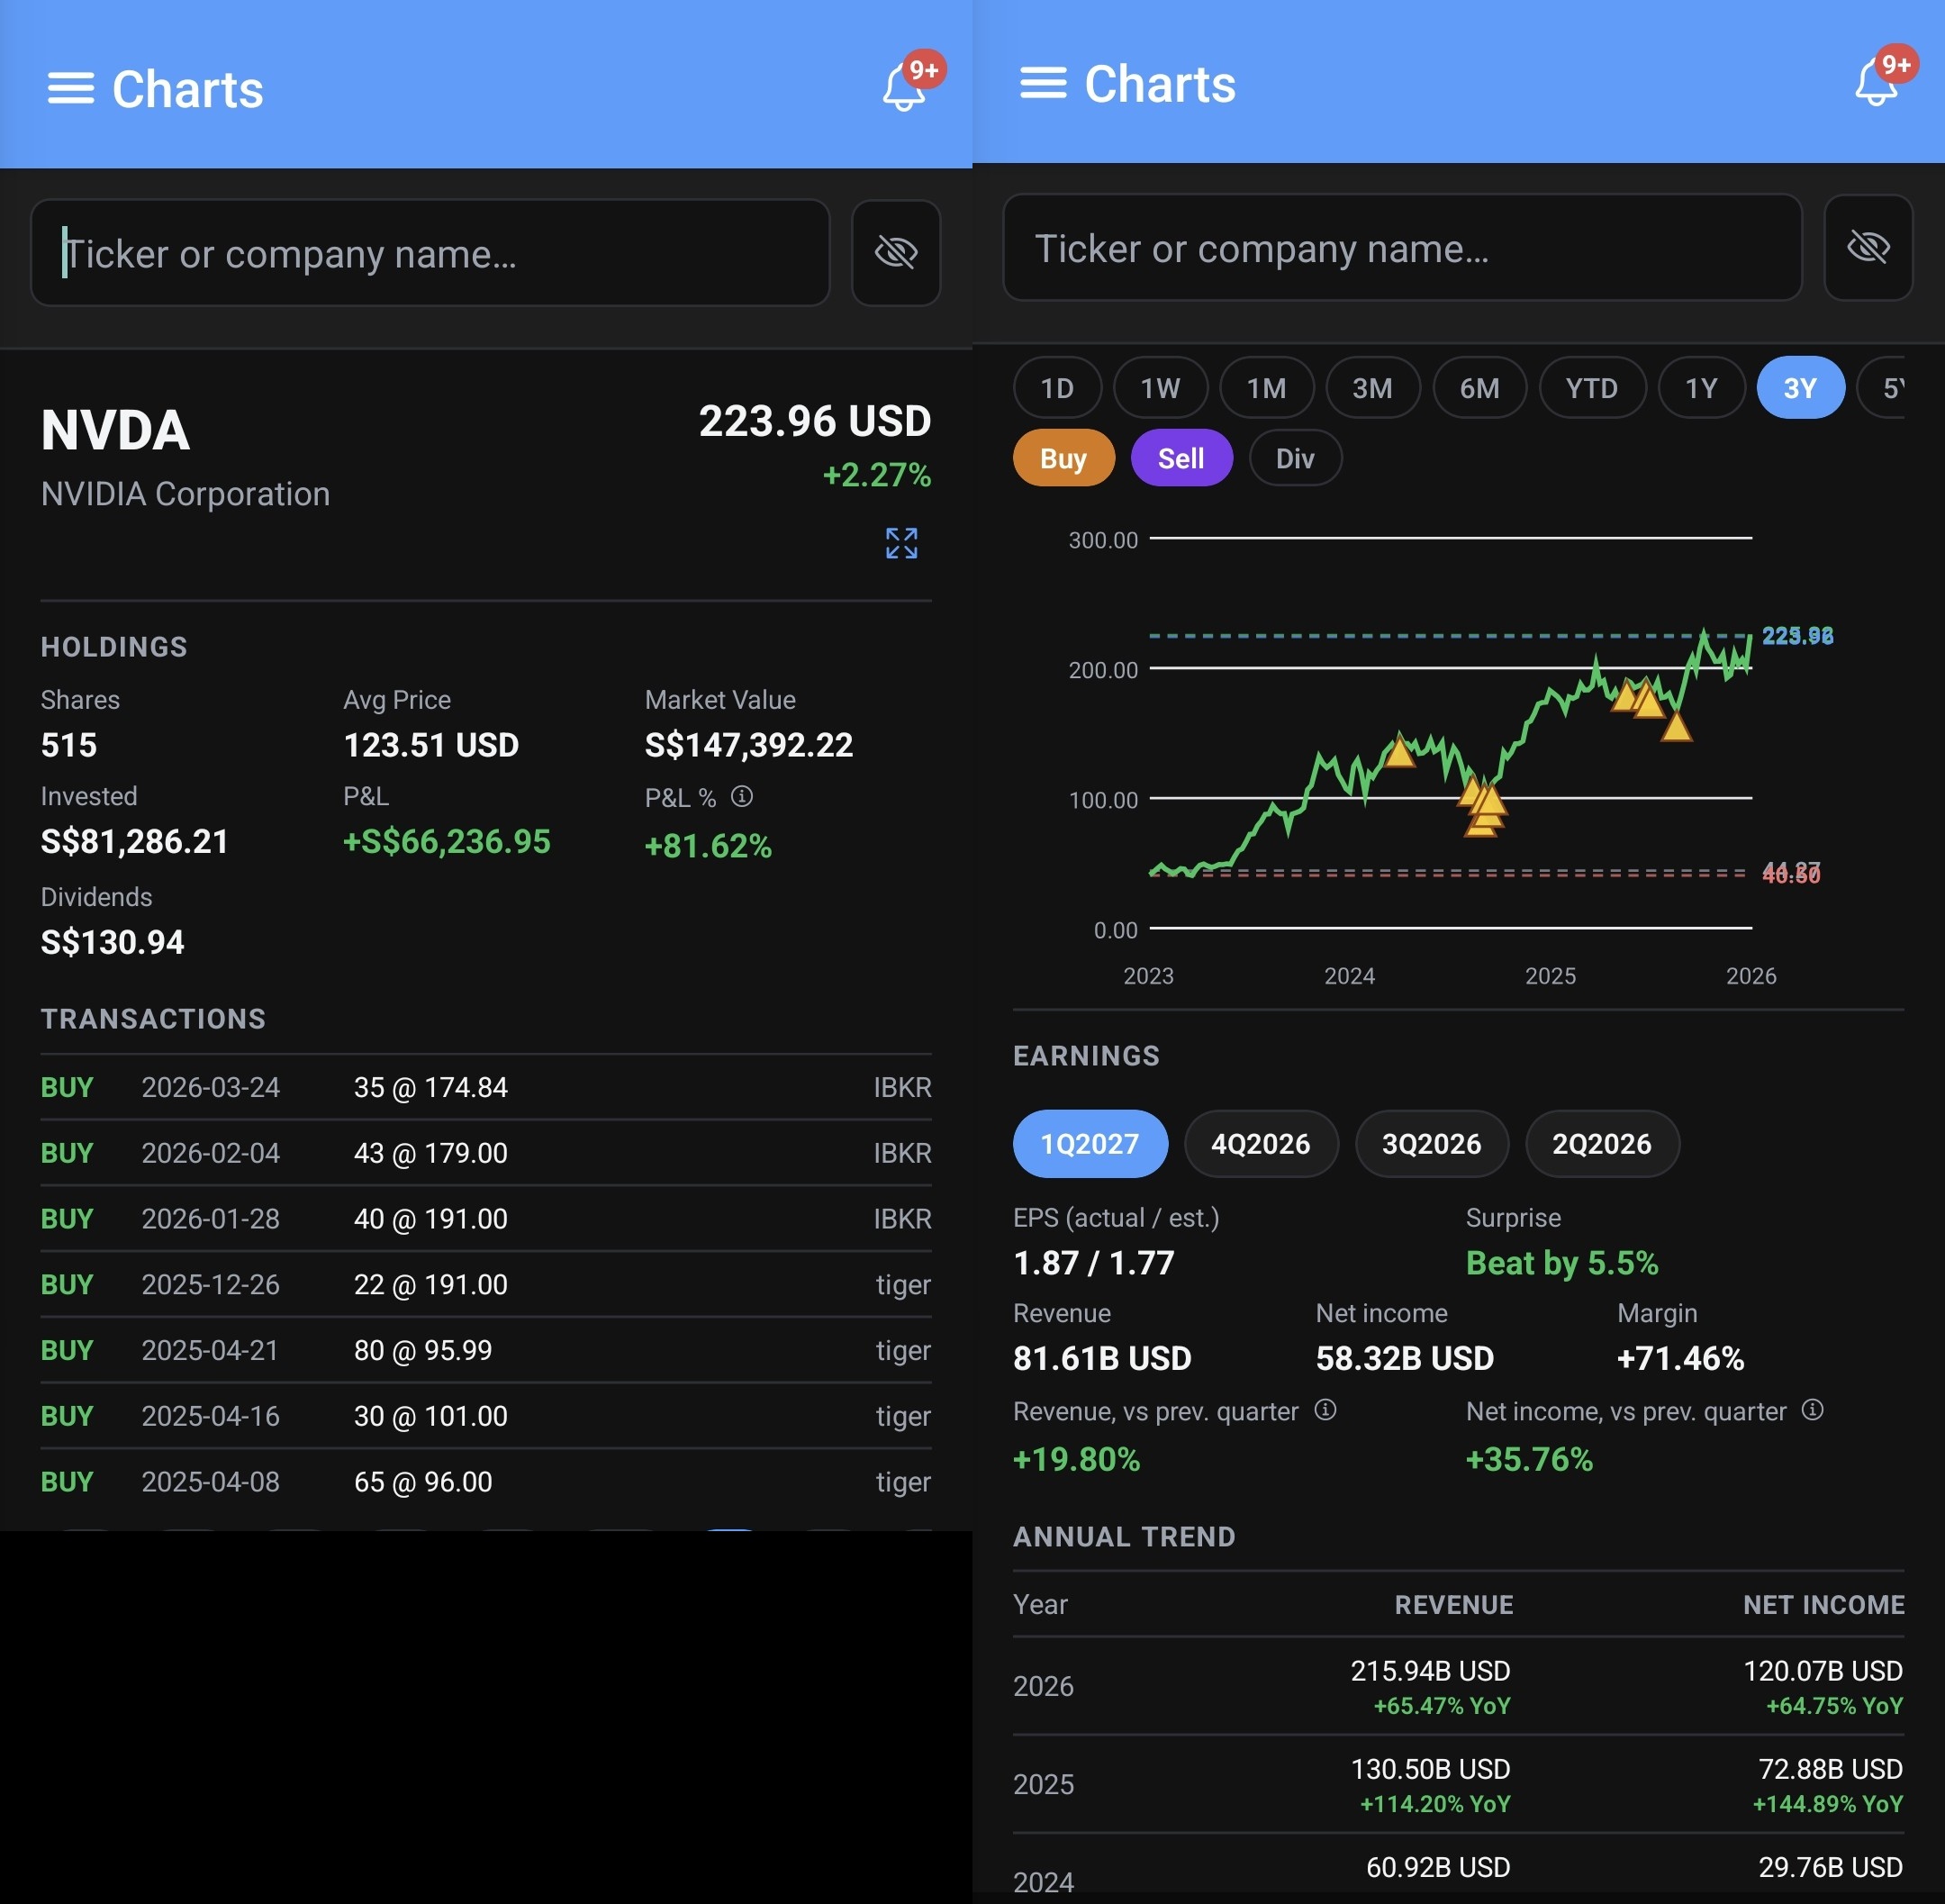
Multiple custom watchlists as sortable tables, with fullscreen pinch-zoom price charts, buy/sell markers, and OHLC reference lines.

ScreenshotWatchlist fullscreen chart
Watch

How to do the important things

Short walkthroughs — drop your YouTube Shorts embed codes into the placeholders below.

YouTube ShortAdding a multi-broker transaction
Recording your first trade
YouTube ShortSetting up a custom portfolio group
Grouping your portfolio your way
YouTube ShortReading the TWR vs MWR chart
Understanding your real return
YouTube ShortImporting transactions from Excel
Bulk import walkthrough